
- Solana’s price dropped by over 11% in the last 7 days
- Metrics and market indicators hinted at a price hike on the charts
The ongoing market seems bearish for most cryptos, including top altcoins like Solana [SOL] that are struggling to paint their charts green. However, if the macro perspective is to be considered, then things might turn bullish soon.
This is how it will play out, especially if the altcoins follow a specific historical trend.
History might repeat itself again
CoinMarketCap’s data revealed that Ethereum [ETH]‘s price dropped by over 4% in the last 7 days. In fact, other top alts like BNB and Solana saw declines of 11% and 12%, respectively.
In the meantime, Moustache, a popular crypto analyst, shared a tweet highlighting an interesting development. The tweet rightly pointed out that altcoins have been following a pattern similar to that of 2016–17. During that time, the altcoin’s market cap consolidated near its 2012 market high for some time, before shooting up to new highs in 2017.
Similarly, in 2014, altcoins’ market cap was consolidating near its 2017 ATH. Therefore, if history repeats itself, investors might soon see altcoins, including SOL, hit new highs.
Will Solana lead the altcoin rally?
AMBCrypto then planned to analyze SOL’s on-chain data to see whether it hinted at a bull rally in the coming days. As per our analysis of Santiment’s data, SOL’s weighted sentiment improved after dipping on 9 June.
This meant that bullish sentiment around the token rose over the last few days. Additionally, its social volume also remained high, reflecting its popularity in the crypto space.
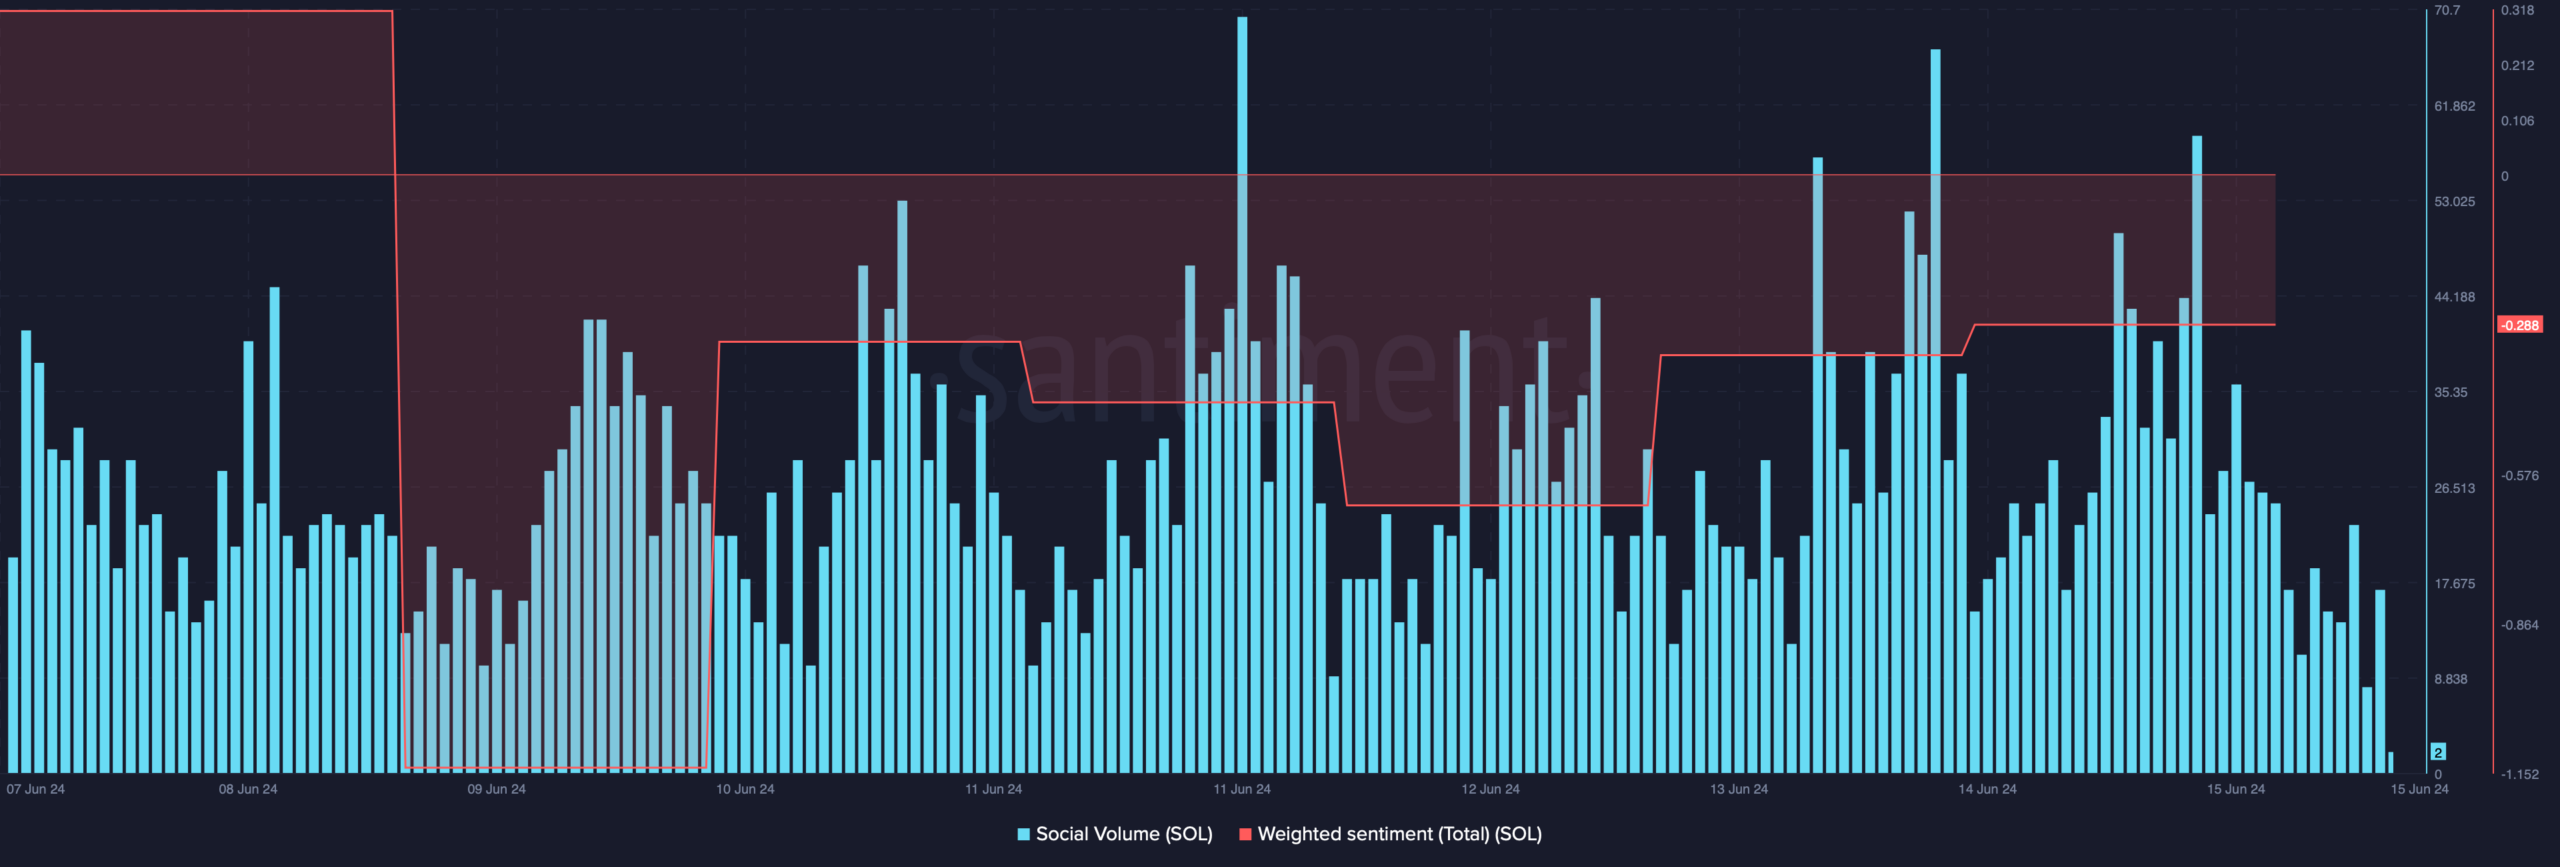
Source: Santiment
Apart from this, things in the derivatives market also looked pretty optimistic for Solana. We found that while SOL’s price dropped, its open interest also declined sharply.
A drop in this metric usually suggests that the chances of a trend reversal are high. Moreover, its funding rate also declined slightly.
Generally, prices tend to move the other way than funding rates, further indicating a possible bull rally on the charts.
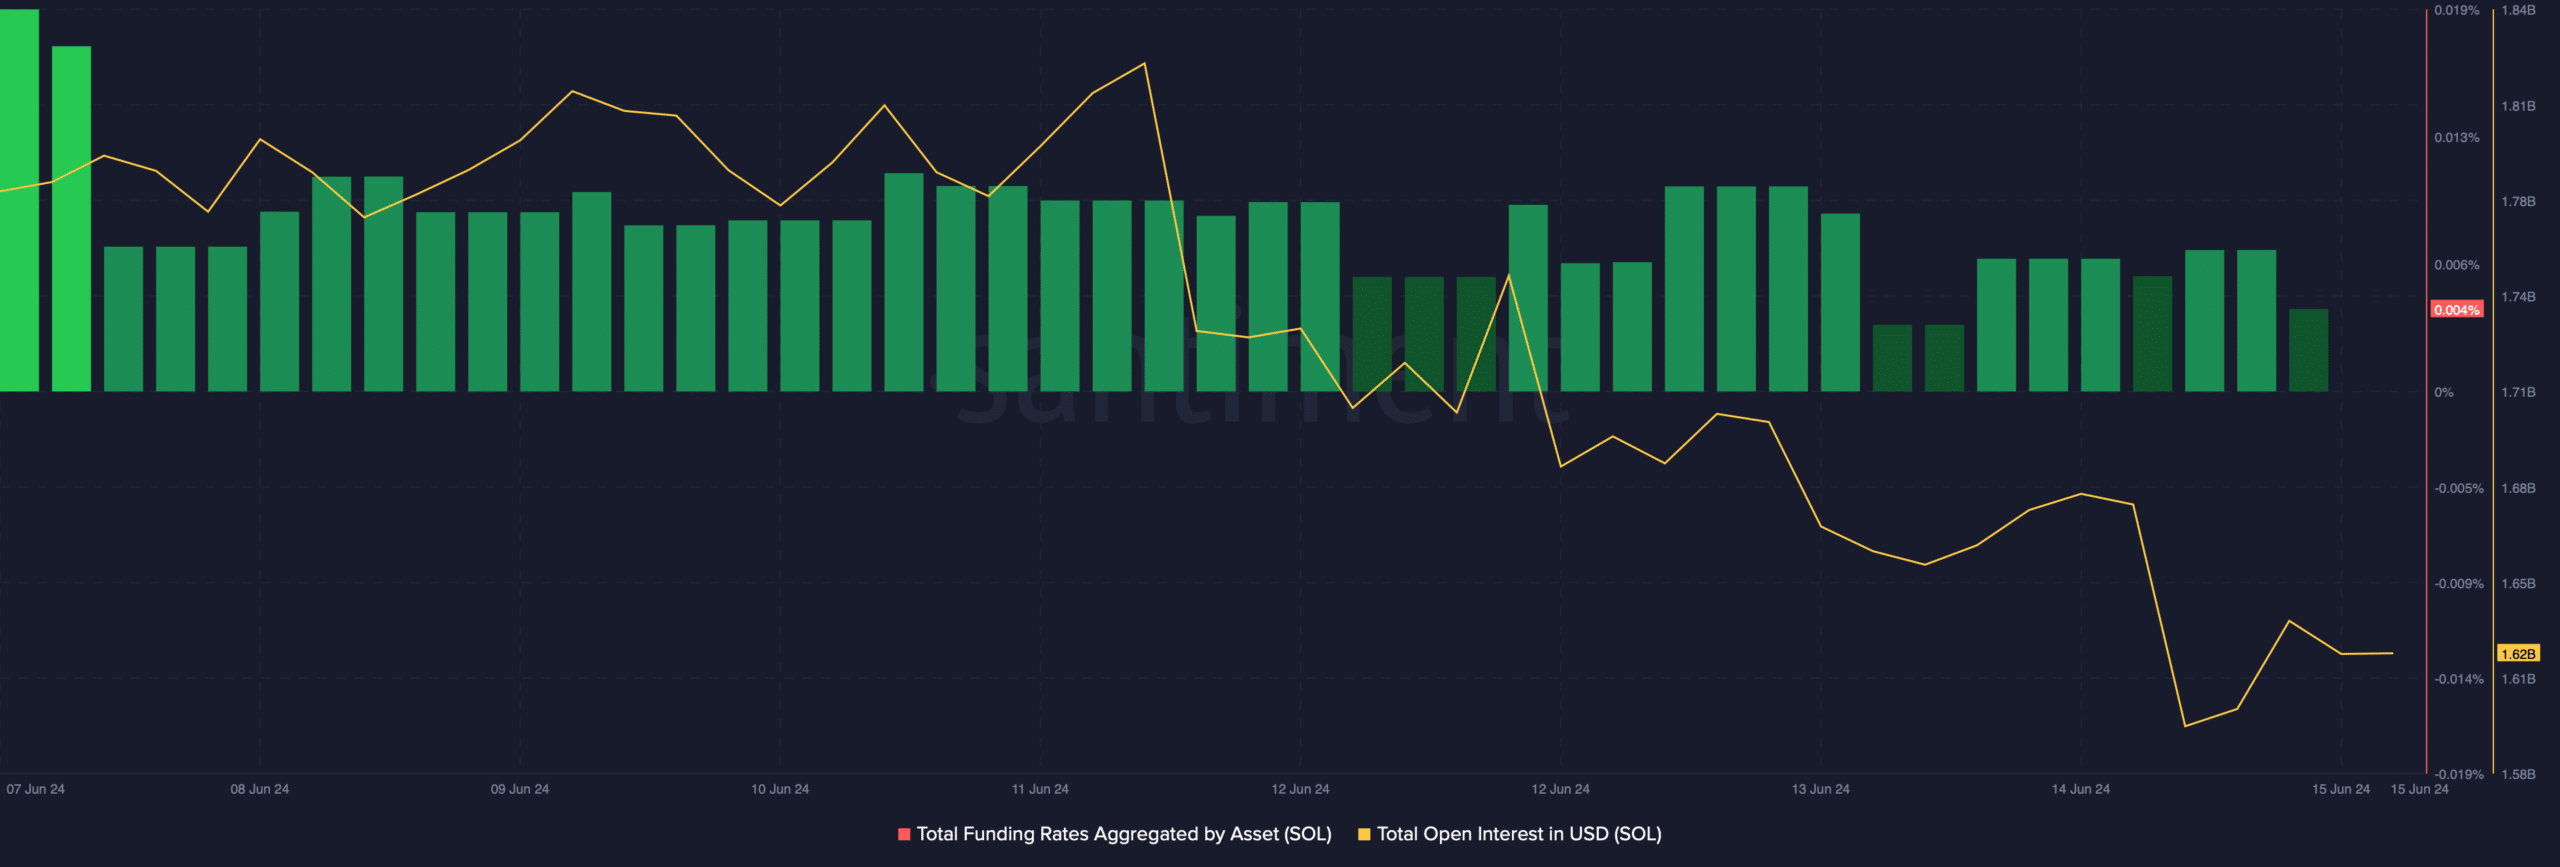
Source: Santiment
Finally, we then took a look at SOL’s daily chart to see whether market indicators also supported the possibility of a bullish breakout. As per our analysis, its Relative Strength Index (RSI) remained under the neutral level. Nonetheless, it did register a slight uptick.
Is your portfolio green? Check out the SOL Profit Calculator
A similar pattern was also noted by the Chaikin Money Flow (CMF).
If these indicators and metrics pan out as expected, then it’s very likely that Solana, along with other altcoins, will hit a new ATH in the next few months.
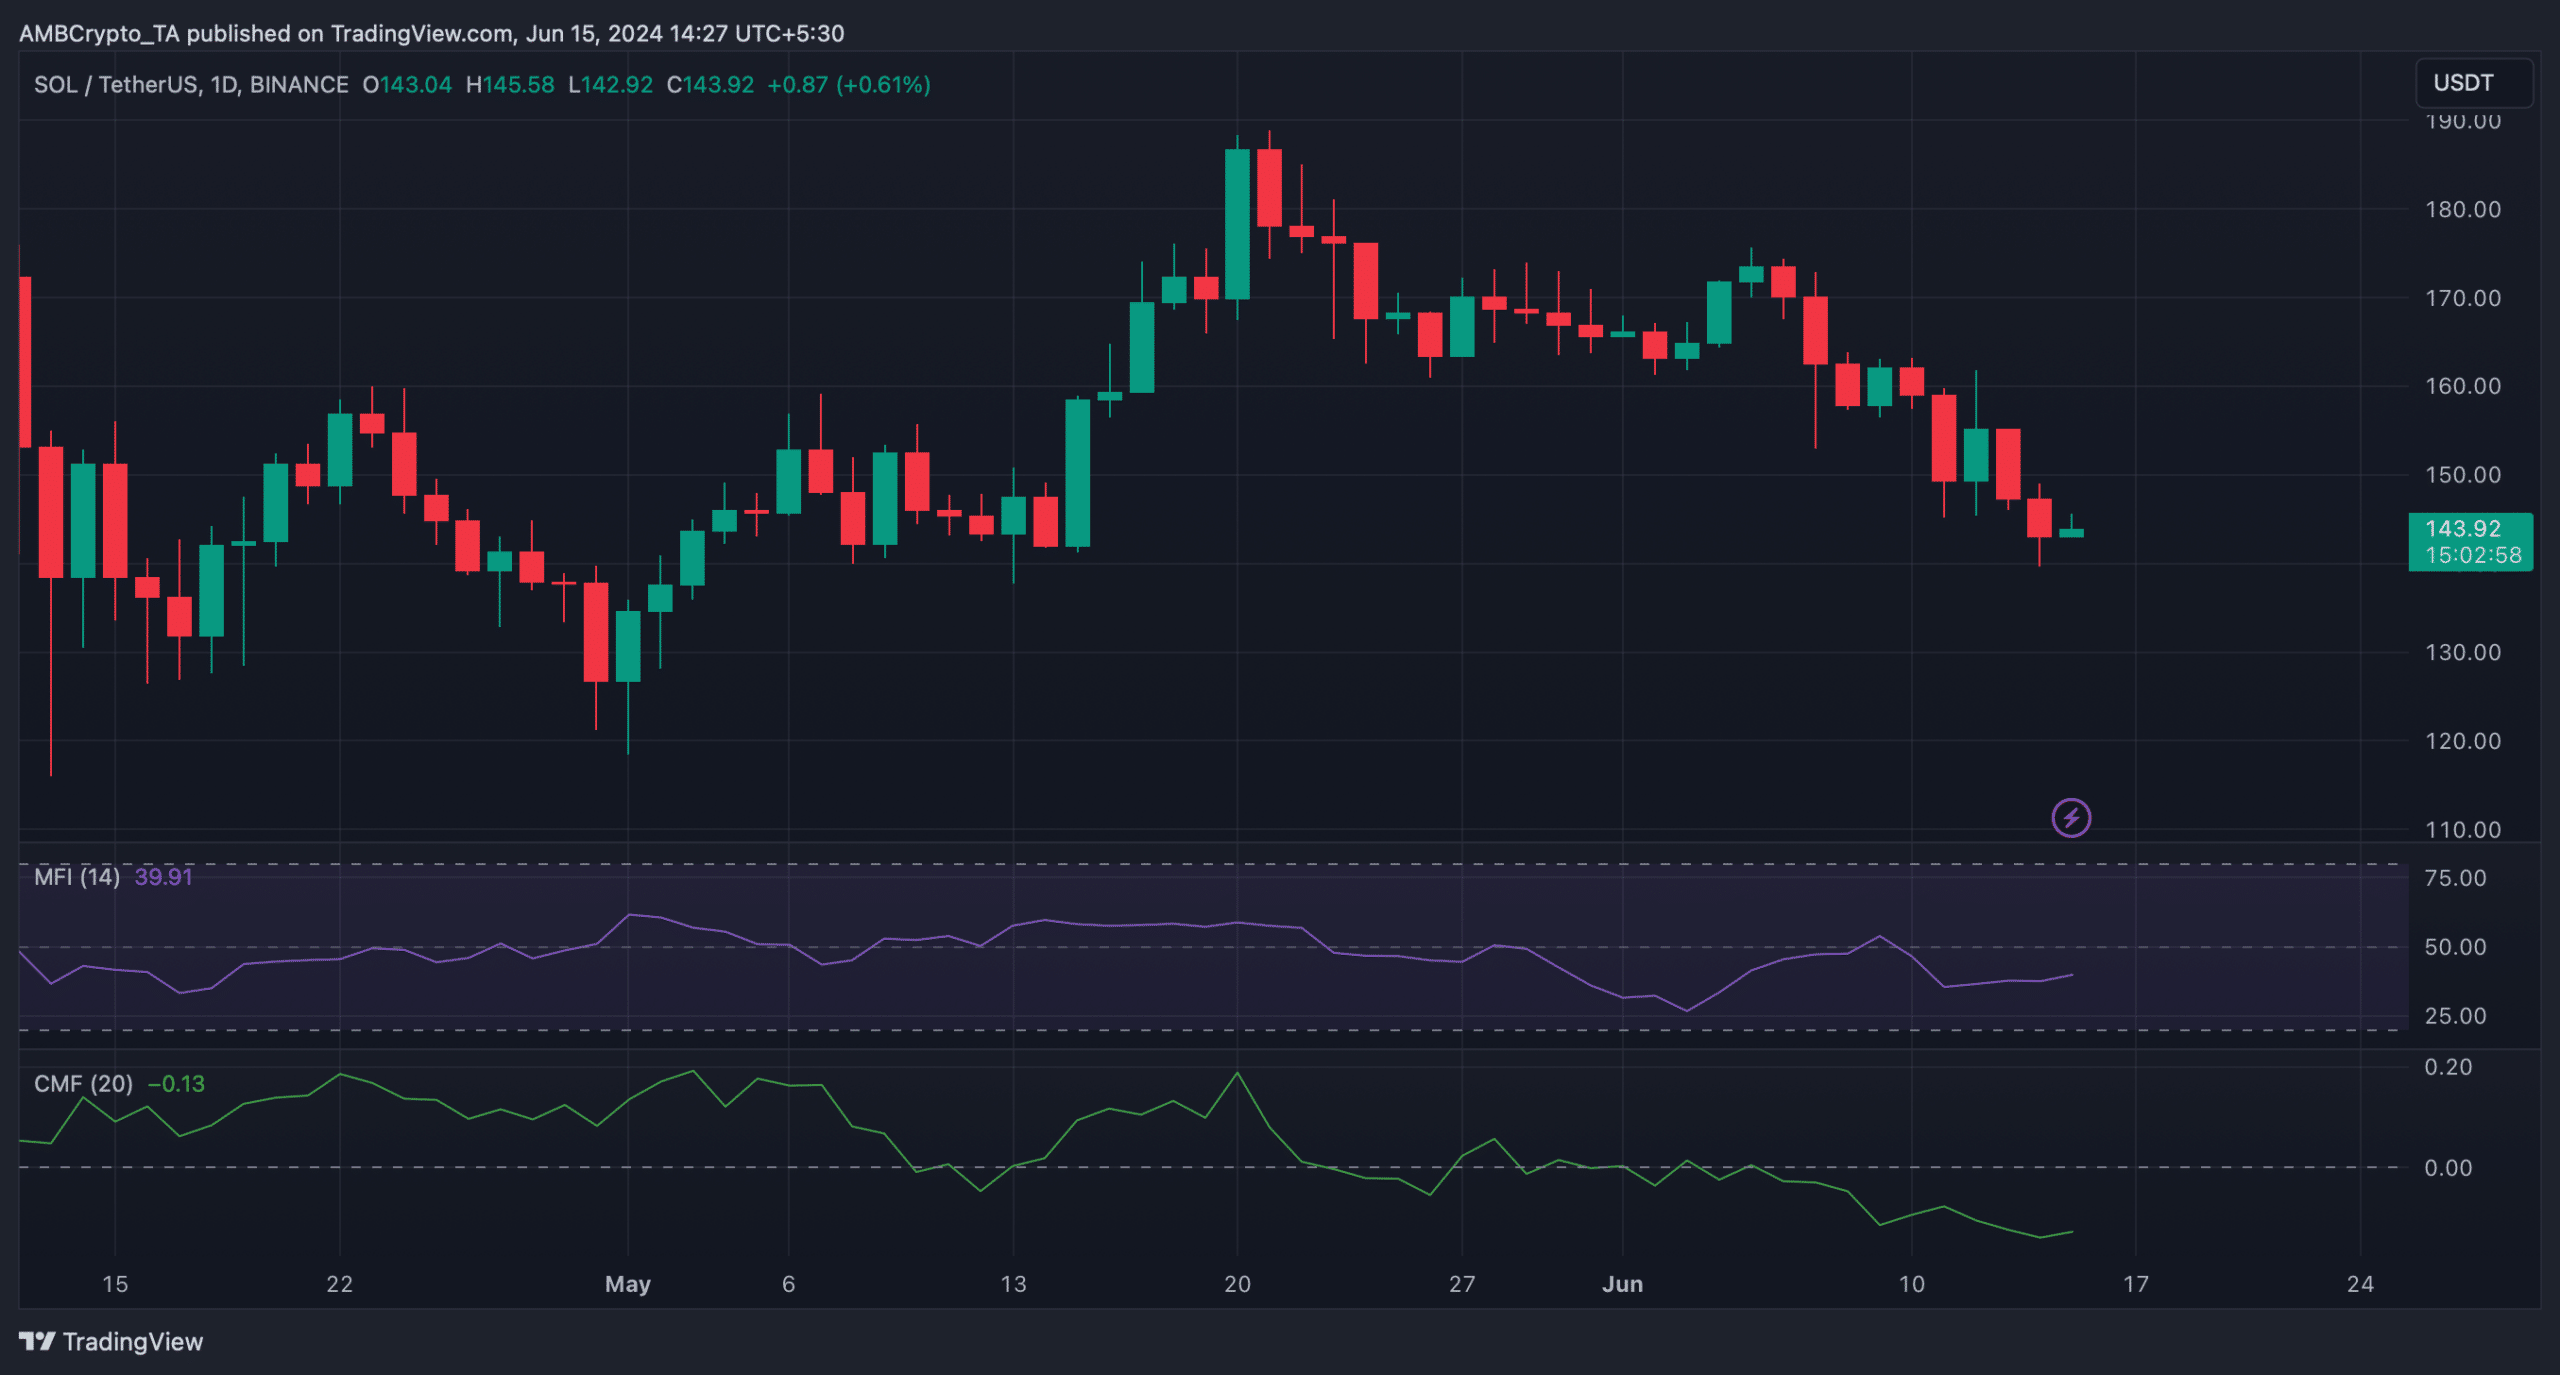
Source: TradingView