- AAVE’s breakout above $153.98 resistance level sparks strong buying interest and new cycle highs.
- Technical indicators suggest AAVE’s bullish trend may continue, with $200 and $261 in sight.
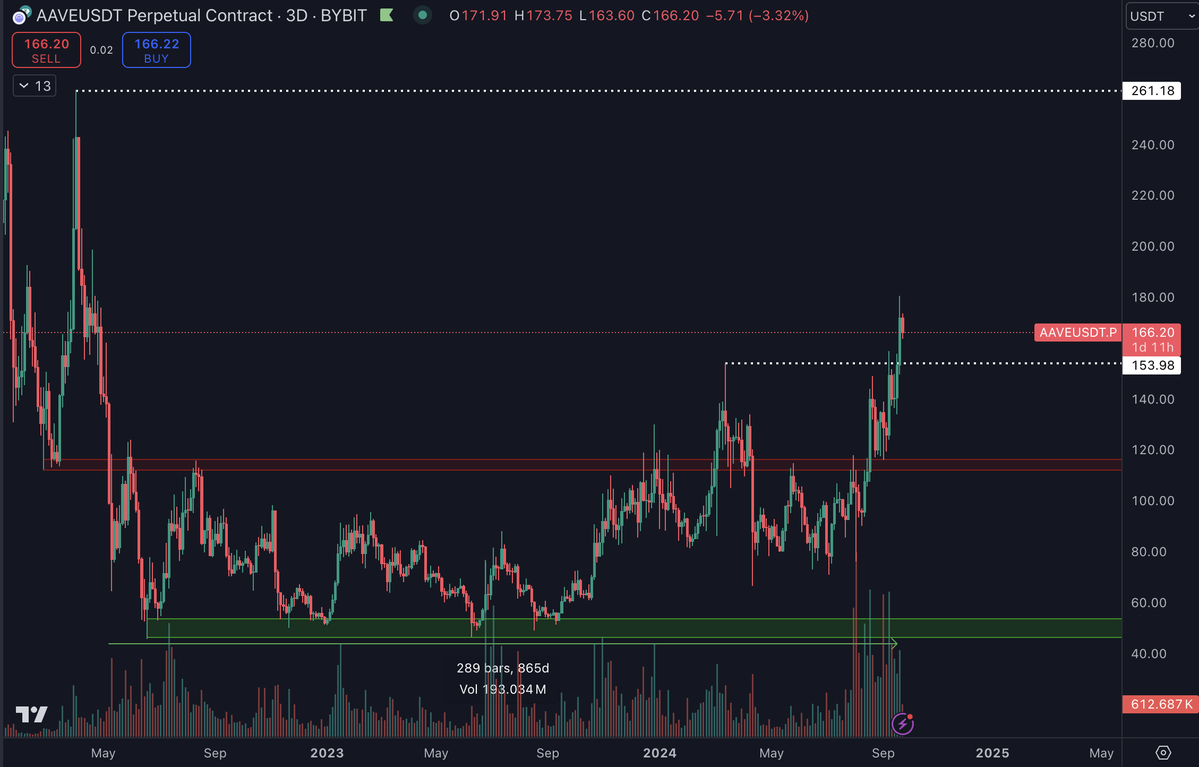
Aave [AAVE] has recently made a notable move by breaking above the key resistance level of $153.98. This breakout has propelled the token into new cycle highs, attracting buying interest.
With the price at $168.64 at press time, AAVE continued to exhibit strong upward momentum backed by increasing trading volume and bullish technical indicators.
Following the recent breakout, AAVE was targeting the $200 level, which served as a critical psychological and technical resistance.
Daan Crypto Trades, a crypto analyst, suggested that if AAVE successfully breaches this level, the next potential target could be around $261.18, aligning with previous highs seen in early 2022.

Source: X
This outlook reflected the market’s current bullish sentiment, driven by robust buying pressure.
The limited historical price action in the current trading zone suggested the possibility of rapid price movements as AAVE explores new levels.
With the token trading well above key moving averages, the ongoing bullish trend remains strong, indicating that further gains could be possible if current market conditions persist.
Continued bullish momentum
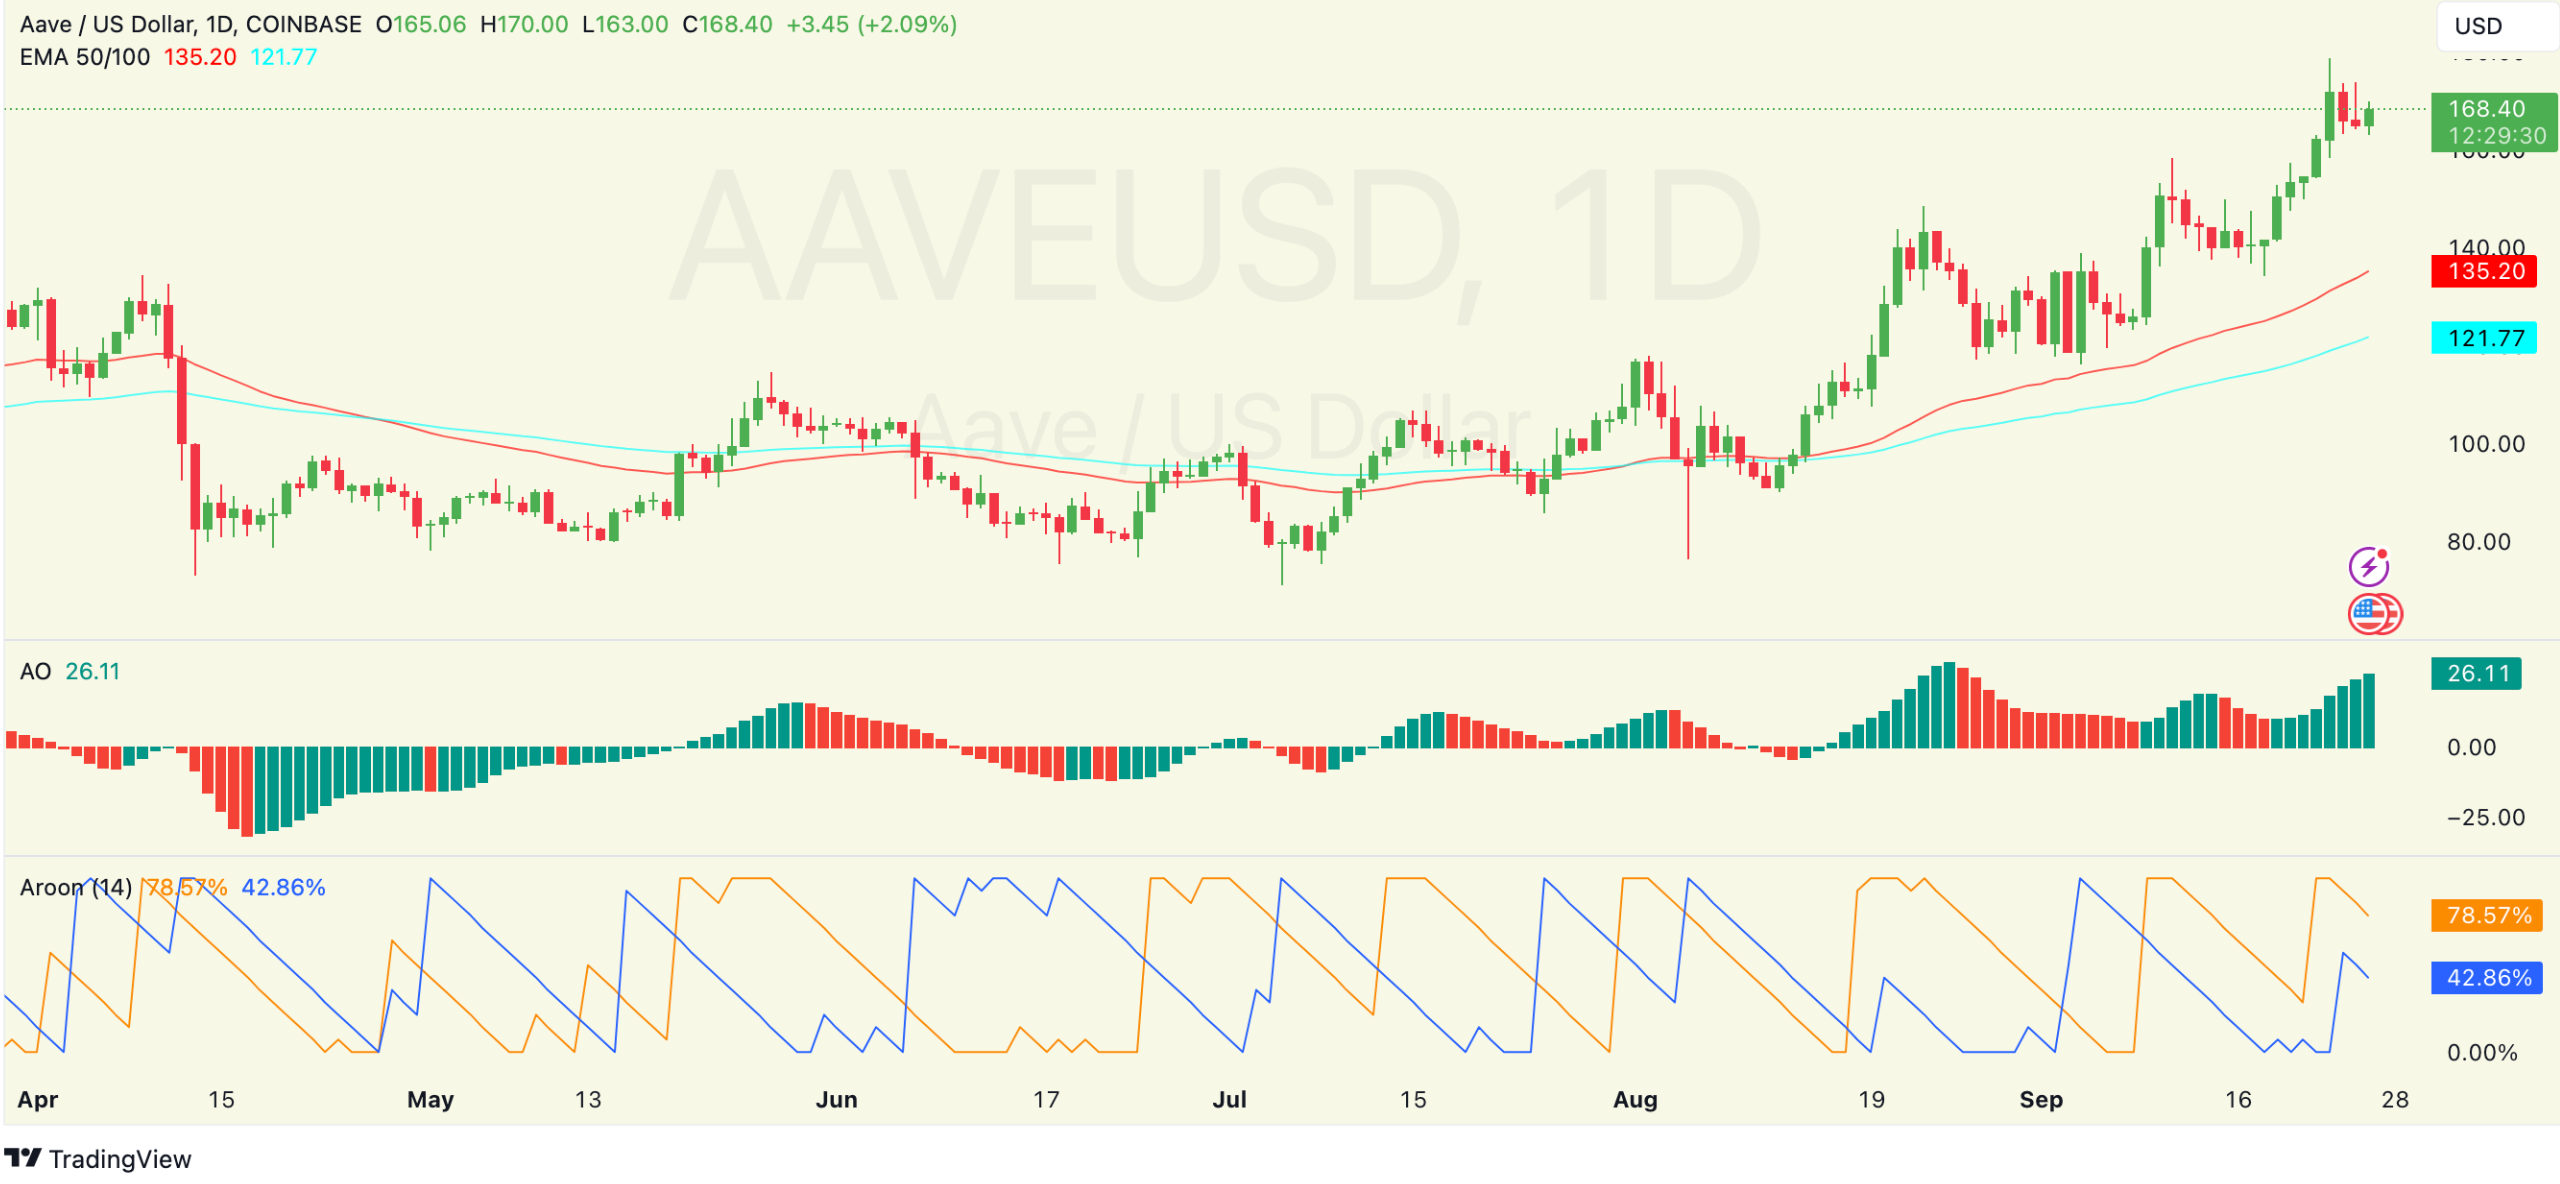
AAVE’s bullish momentum is underscored by its positioning above both the 50-day Exponential Moving Average (EMA) at $135.20 and the 100-day EMA at $121.77.
These technical levels have served as solid support during AAVE’s recent rally, reinforcing its upward trajectory.
The token’s price has consistently stayed above these moving averages, highlighting the strength of the current trend.


Source: TradingView
The Awesome Oscillator (AO) was 26.11 at press time, with expanding green bars suggesting increasing bullish strength.
This indicator, which measures market momentum, continued to signal positive sentiment, supporting the ongoing upward price movement.
The expansion of green bars on the histogram further pointed to a strong buying interest, aligning with AAVE’s recent gains.
Will AAVE’s run continue?
Moving forward, the Aroon indicator, used to gauge market trends, showed a clear dominance of bullish signals.
The Aroon Up (blue) was at 42.86%, while the Aroon Down (orange) was 78.57%, indicating that recent highs have been reached and that bullish signals currently overshadow bearish ones.
This setup reflected strong bullish presence in the market, with sellers showing signs of weakening control.
These technical signals, combined with increasing trading volume and positive market sentiment, suggest that AAVE’s recent breakout could be the beginning of a sustained upward trend.
AAVE’s trading volume over the past 24 hours stands at $295,637,016, reflecting a 0.85% price increase within the last day and a 16.74% gain over the past week.
Read Aave’s [AAVE] Price Prediction 2024–2025
The token’s circulating supply of 15 million AAVE gives it a market cap of $2,527,476,128, further highlighting its growing presence in the DeFi space.
As AAVE continues its upward movement, market participants are keeping a close eye on whether the $200 price target will be reached and if the bullish momentum can be maintained.

