
- Ethereum’s price dropped by over 3% in the last 7 days
- A key metric revealed that ETH was undervalued, hinting at a recovery on the charts
Ethereum’s [ETH] price action turned bullish on 28 June, giving investors hope for a recovery from their past losses. Unfortunately, this bullish trend didn’t last for long, as the coin recorded a price correction soon after. This led to both its weekly and daily charts flashing red.
Ethereum faces rejection
After the aforementioned hike in price, ETH’s bears stepped up again and pushed the altcoin’s price down by more than 3%. At the time of writing, the king of altcoins was trading at $3,391.51 with a market capitalization of over $407 billion.
The worst news was that Ethereum got rejected from the upper limit of a bullish wedge pattern in the recent past. As per a tweet from ZAYK Charts, a popular crypto analyst, the token’s price started to consolidate inside the pattern in late May. A successful breakout could have resulted in a 30% price rise, which might have allowed Ethereum to go past $4k.
Interestingly, a similar pattern had emerged earlier in March, only to break out in May. This allowed the altcoin to hit $3.89k on the charts. However, since ETH got rejected this time, the chances of history repeating itself might be slim.

Source: X
Won’t ETH recover?
AMBCrypto then took a closer look at Ethereum’s current state to see whether it would fail to break out of the bullish pattern.
We found that market sentiment around the king of altcoins remained bearish. This was evidenced by the dip in its weighted sentiment after spiking on 28 June. Its network growth also dropped slightly, meaning that fewer addresses were created to transfer the token.
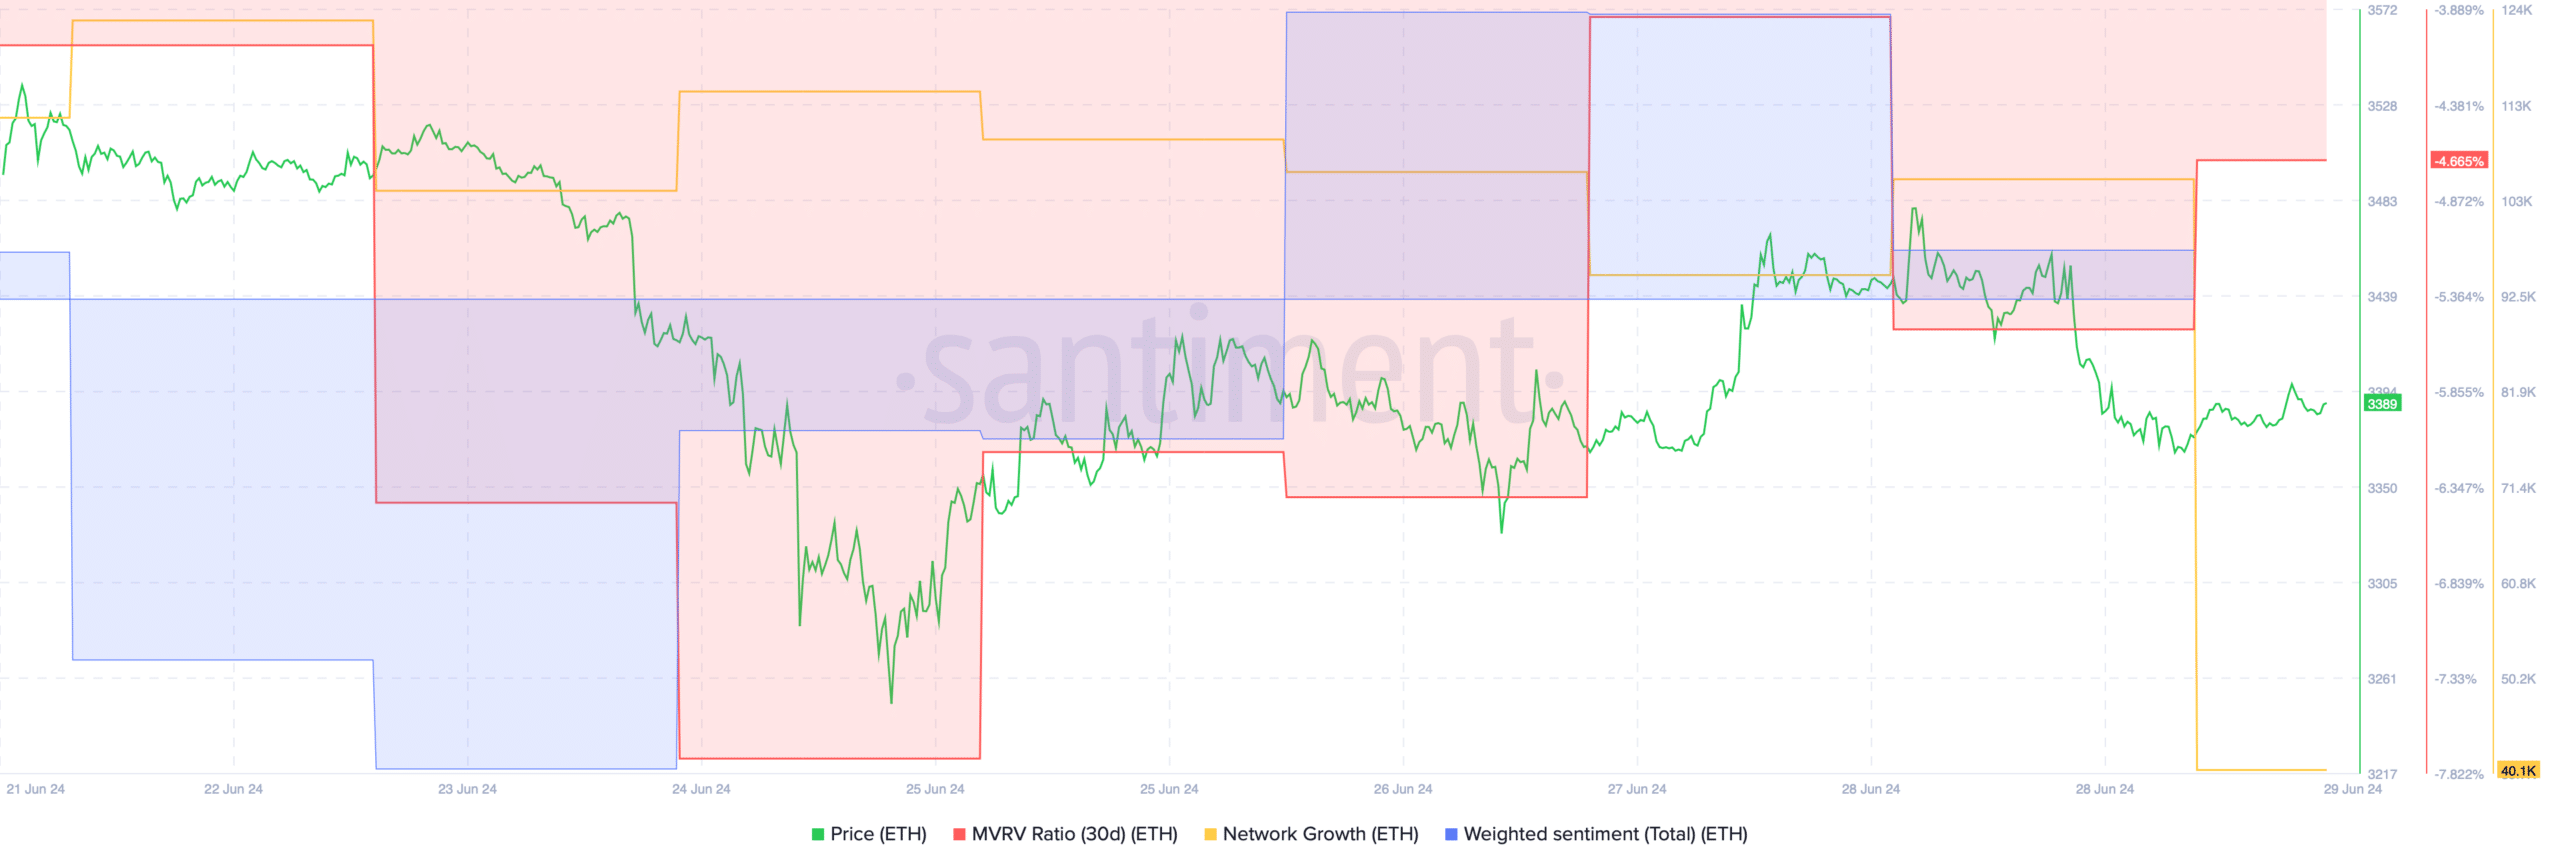
Source: Santiment
Nonetheless, a few of the metrics were in favor of a successful breakout.
For example, the MVRV ratio has improved over the last few days, which can be interpreted as a bullish signal.
AMBCrypto’s assessment of Glassnode’s data also revealed that Ethereum’s NVT ratio had declined sharply. A drop in this metric usually means that an asset is undervalued – Implying an incoming price hike.
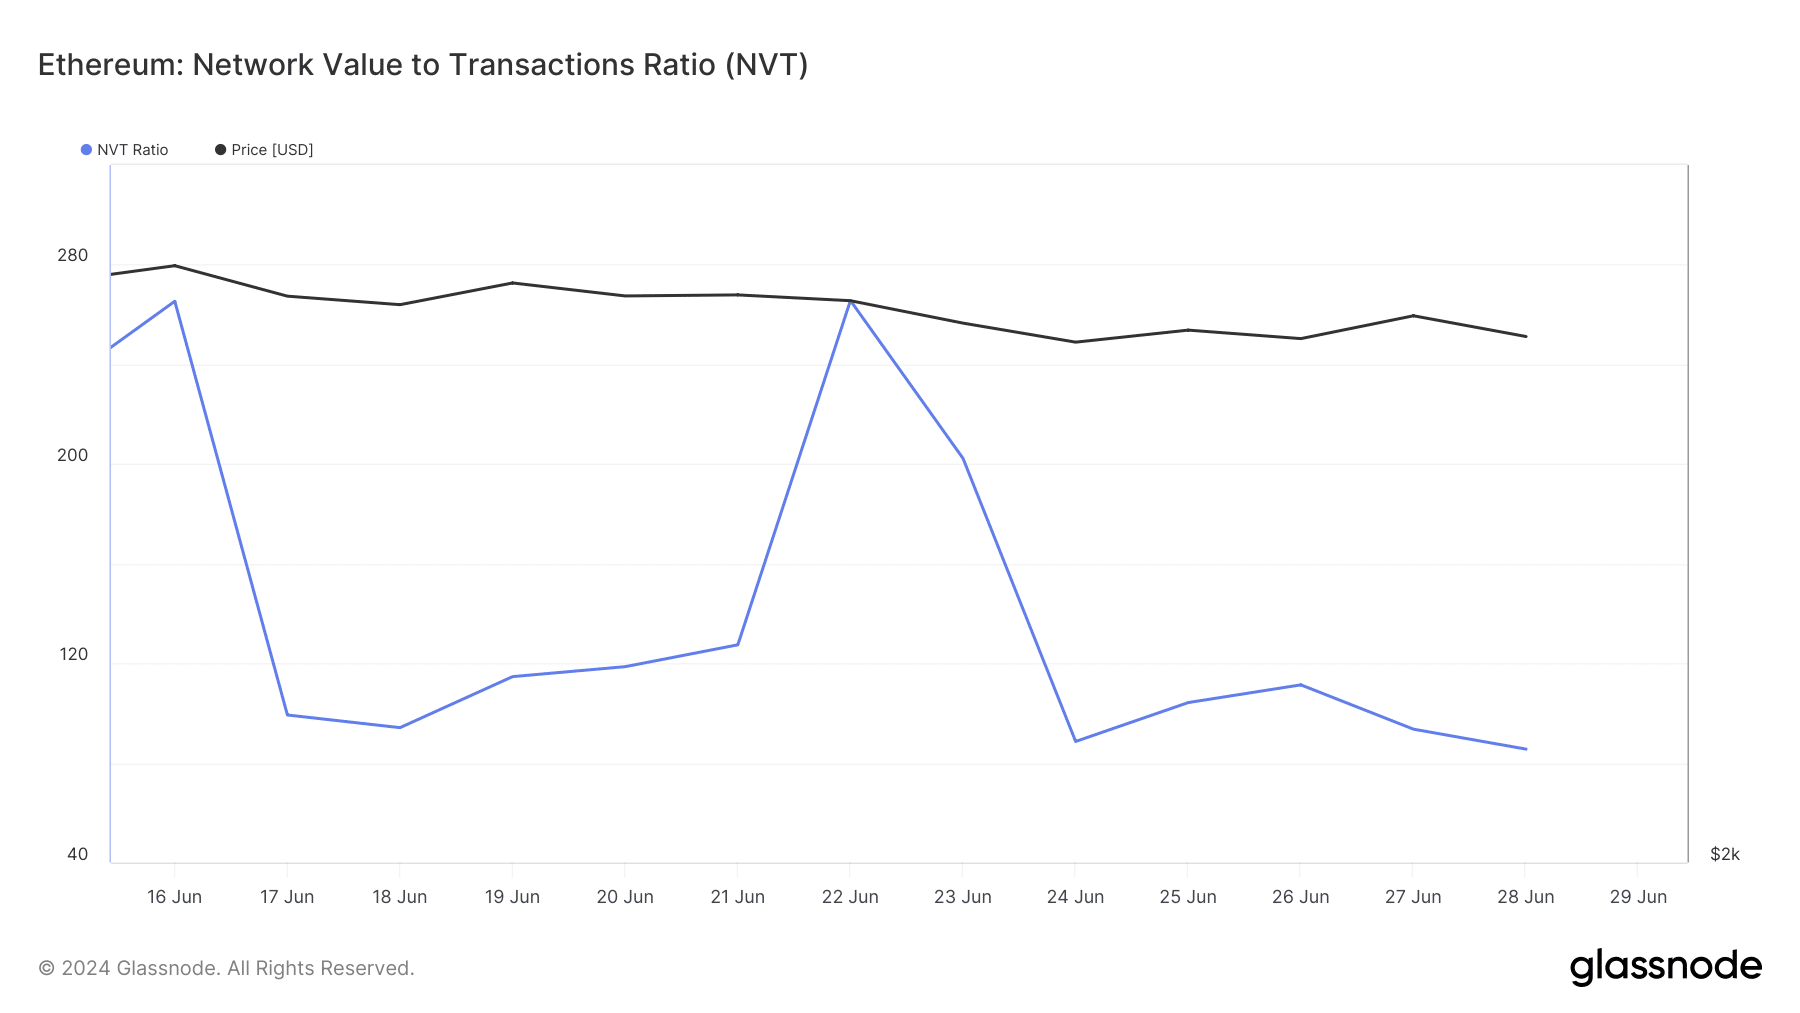
Source: Glassnode
AMBCrypto then took a look at Hyblock Capital’s data to look for immediate support and resistance levels.
As per our analysis, it would be crucial for ETH to touch and go above the $3.5k-mark in order to sustain a bull rally as liquidations would rise sharply. Generally, a hike in liquidations often results in price corrections on the charts.
Is your portfolio green? Check out the ETH Profit Calculator
On the other hand, if bears continue to dominate and ETH’s volatility rises in a southbound direction, then it might fall to $3,060.

Source: Hyblock Capital