- Bears aggravated Cardano’s descent over the past few months as the crypto fear and greed index slipped into the ‘fear’ zone.
- The altcoin’s Funding Rates took a hit, but the long/short ratio still showed some hope for the bulls.
As the broader market’s sentiment turned bearish over the last day, Cardano [ADA] continued its long-term downtrend after chalking out a bearish pattern on its daily chart.
The bearish pressure accelerated after the recent pattern break and amid the market-wide uncertainties.
However, a reversal from the support level in the $0.37 level can reignite some bullish tendencies and help the buyers find a move above the daily EMAs.
At the time of writing, ADA traded near the $0.37 region, down by around 2% in the last 24 hours.
Can ADA bulls stop the bleeding?
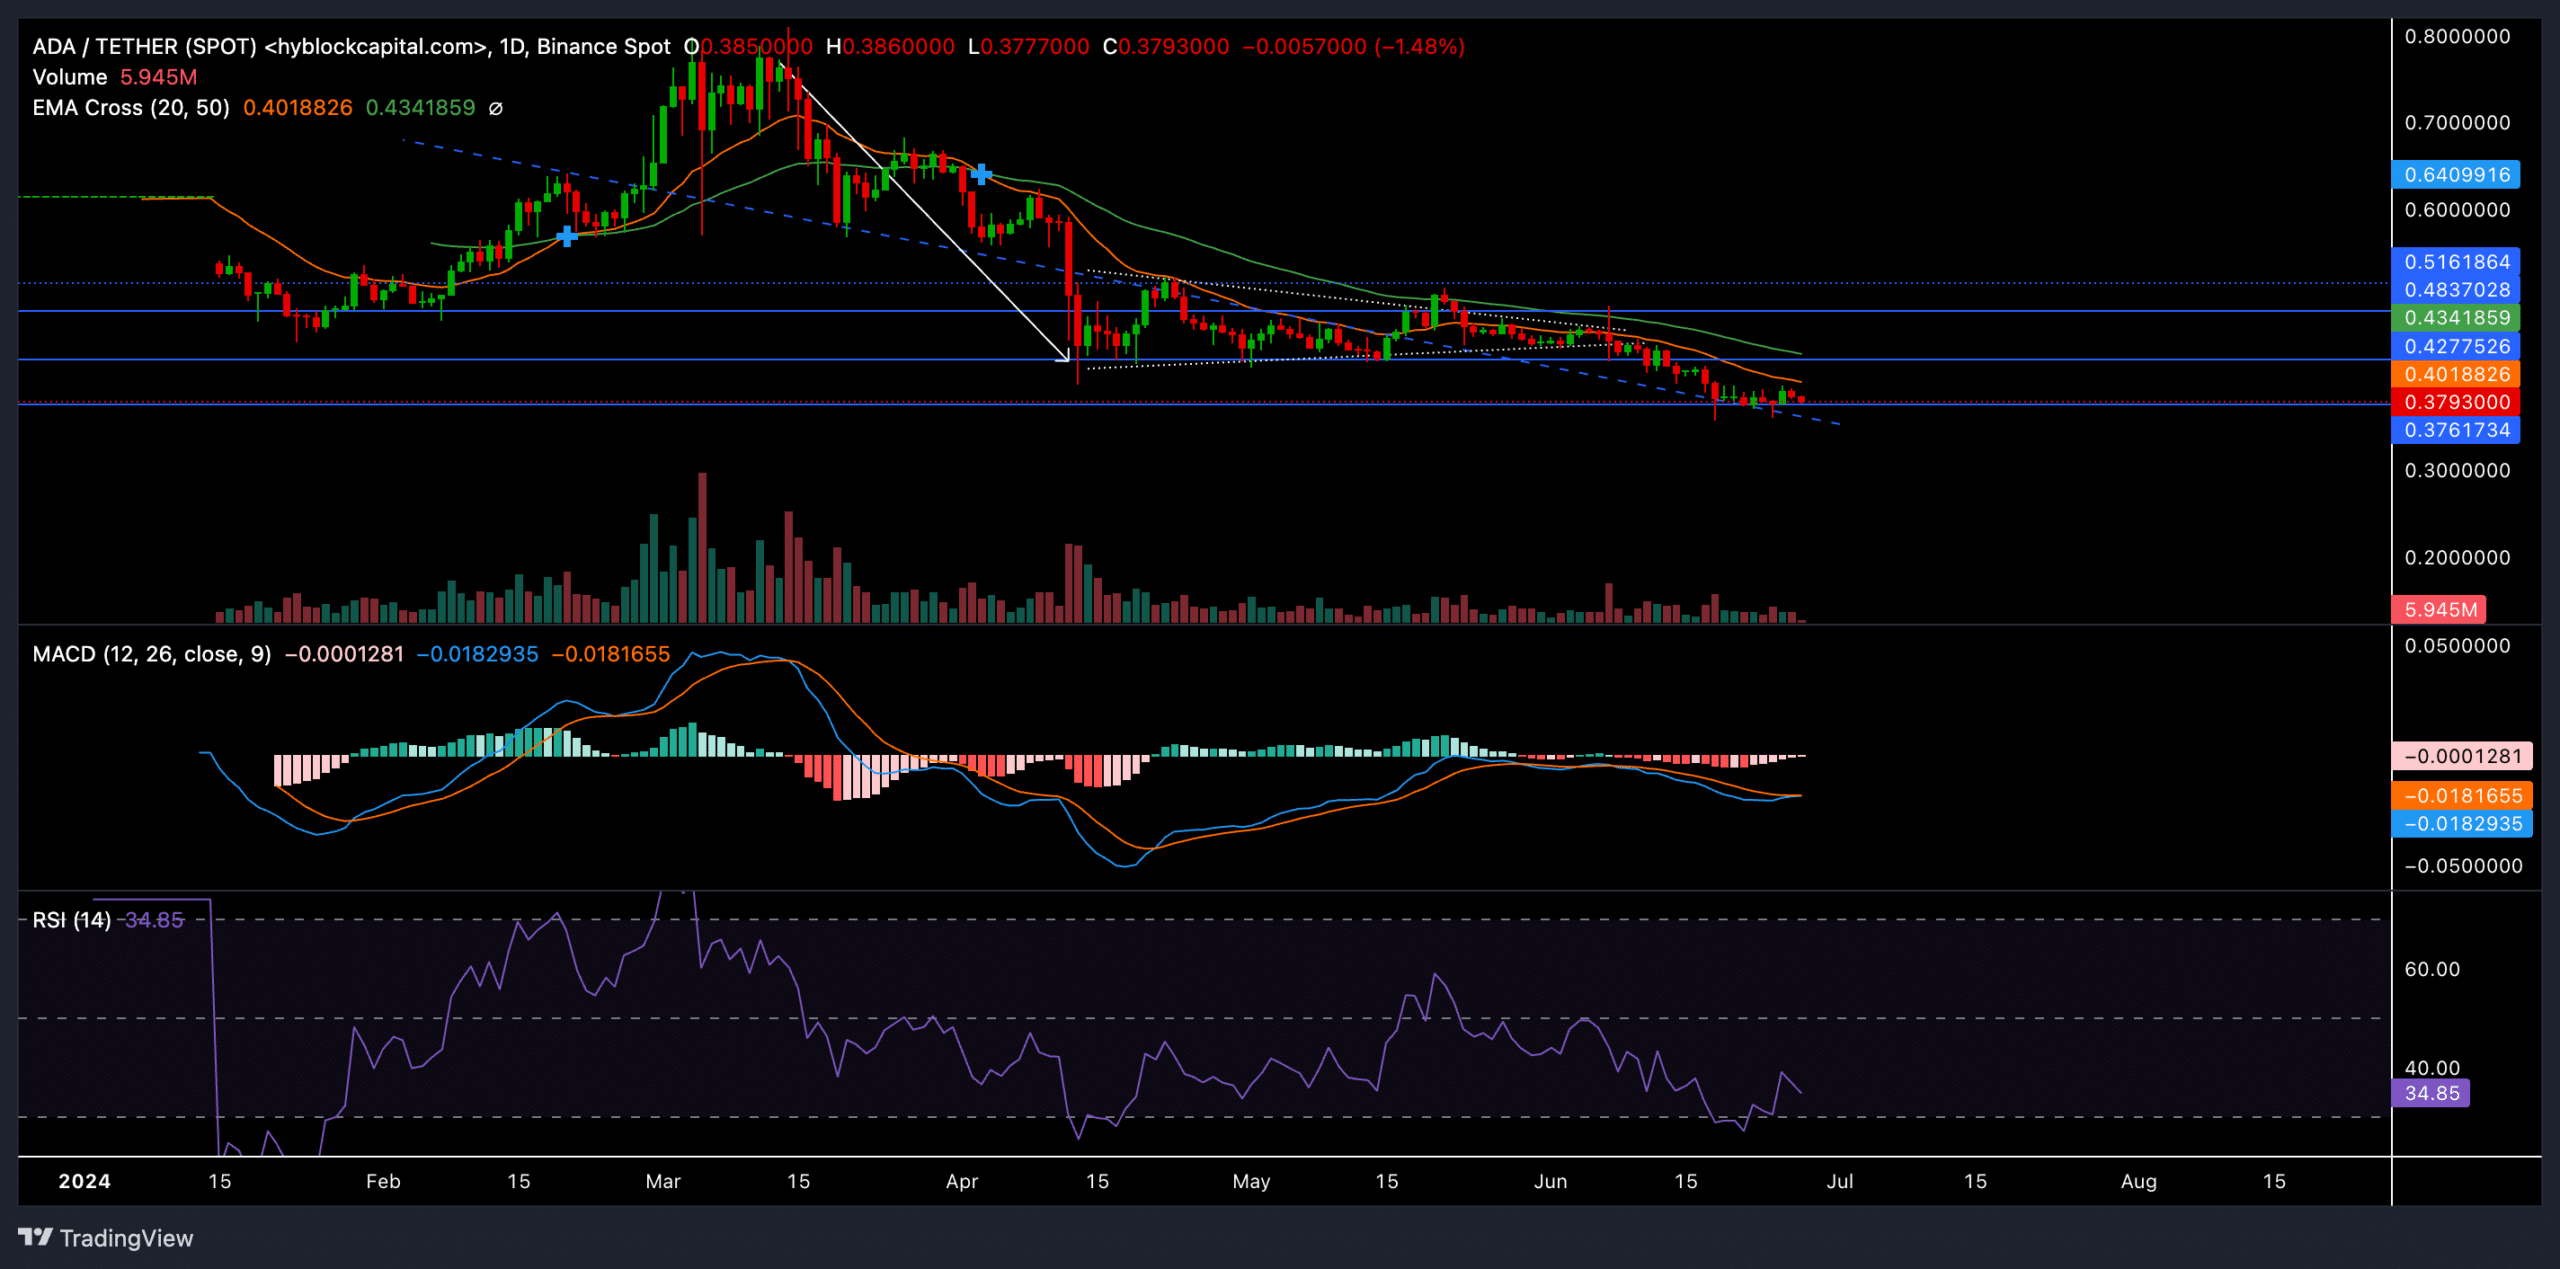
Source: Hyperblockcapital, ADA/USDT
ADA has struggled to find a close above the boundary of its 50-day day EMA (green) for nearly three months now.
The bearish crossover of the 20-day EMA (orange) and the 50-day EMA set the stage for a rather extended downtrend.
The buyers strived to trigger an uptrend but failed to jump above the $0.48-$0.51 resistance range. Consequently, the price action chalked out a classic symmetrical triangle-like structure on ADA’s daily chart.
The recent decline below the crucial $0.42 resistance level (then support) reaffirmed the bearish edge and confirmed the symmetrical triangle breakout.
As a result, the altcoin lost nearly 15% of its value in less than three weeks as it found support and traded near the $0.37 region at press time.
A convincing close above the immediate support level can put ADA on a path to recovering its recent losses. The altcoin could likely face resistance near the 20-day and 50-day EMAs.
Only a close above these levels can help the bulls start a near-term uptrend. This can help ADA retest the $0.48 level before likely reversing.
If the bears continue to exert more pressure, ADA could immediately test the next major support level at the $0.35 mark.
The Relative Strength Index (RSI) stood near the oversold region. Any likely reversals from this level will confirm the easing selling power.
It’s also worth mentioning that the MACD and Signal lines were below the equilibrium for over three months and showed a rather extended bearish edge.
A likely bullish crossover of these lines can temporarily halt the streak of red candles.
Long/short ratio keeps hopes alive

Source: Coinglass
Amid market uncertainty, ADA’s Funding Rates on most exchanges saw a downtrend over the past few days. However, ADA’s long/short ratio for ADA/USDT on Binance in the past 24 hours stood at 3.7.
Is your portfolio green? Check out the ADA Profit Calculator
Thus, showed there are significantly more long positions than short positions.
This could hint at a potential reversal from ADA’s immediate support level. Nonetheless, the altcoin shared a 90% 30-day correlation with Bitcoin— so keeping track of BTC’s movements would be crucial to gauge ADA’s near-term potential.