
- Bitcoin’s long/short ratio declined sharply on the charts
- A few metrics suggested that investors should still consider buying BTC
It’s been quite a few days since Bitcoin [BTC] started trading below the $70k-mark. While the market’s condition remained somewhat bearish, some big players across the crypto space chose to exit it. Hence, the question – Does this mean investors should no longer consider accumulating BTC? Let’s find out.
Whales are selling Bitcoin
CoinMarketCap’s data revealed that BTC hasn’t managed to climb above $70k since 10 June. In fact, the king of cryptos fell victim to a massive price correction, pushing it under $67k. At the time of writing, BTC was trading at $66,196.58 with a market capitalization of over $1.3 billion.
In the meantime, whales started to reduce their long positions.
AMBCrypto’s analysis of Coinglass data revealed that BTC’s long/short ratio declined sharply too. This is a sign of bearish sentiment, with a greater emphasis on selling or shorting assets.

Source: Coinglass
Meanwhile, Lookonchain recently shared a tweet listing a few key metrics that gave a better picture of whether investors should still consider buying Bitcoin. For starters, the tweet mentioned the Bitcoin Rainbow Chart.
According to the same, the rainbow chart revealed that now is still a good time to buy BTC. Here, the Bitcoin Rainbow Chart is a tool that plots Bitcoin’s long-term price movement on a logarithmic scale.
The Relative Strength Index (RSI) is also a crucial indicator. According to Lookonchain’s data, BTC’s RSI had a value of 69.93. This, when compared to historical data, implied that BTC has still not reached a market top. Apart from this, the 200-week moving average heat map highlighted that the prevailing price point was blue. Simply put, the price top has not been reached yet, and it is time to hold and buy.
Anything bullish in the short-term?
Since the aforementioned datasets pointed to BTC’s potential to grow further, AMBCrypto then analyzed Santiment’s data to look out for any other bullish signals.
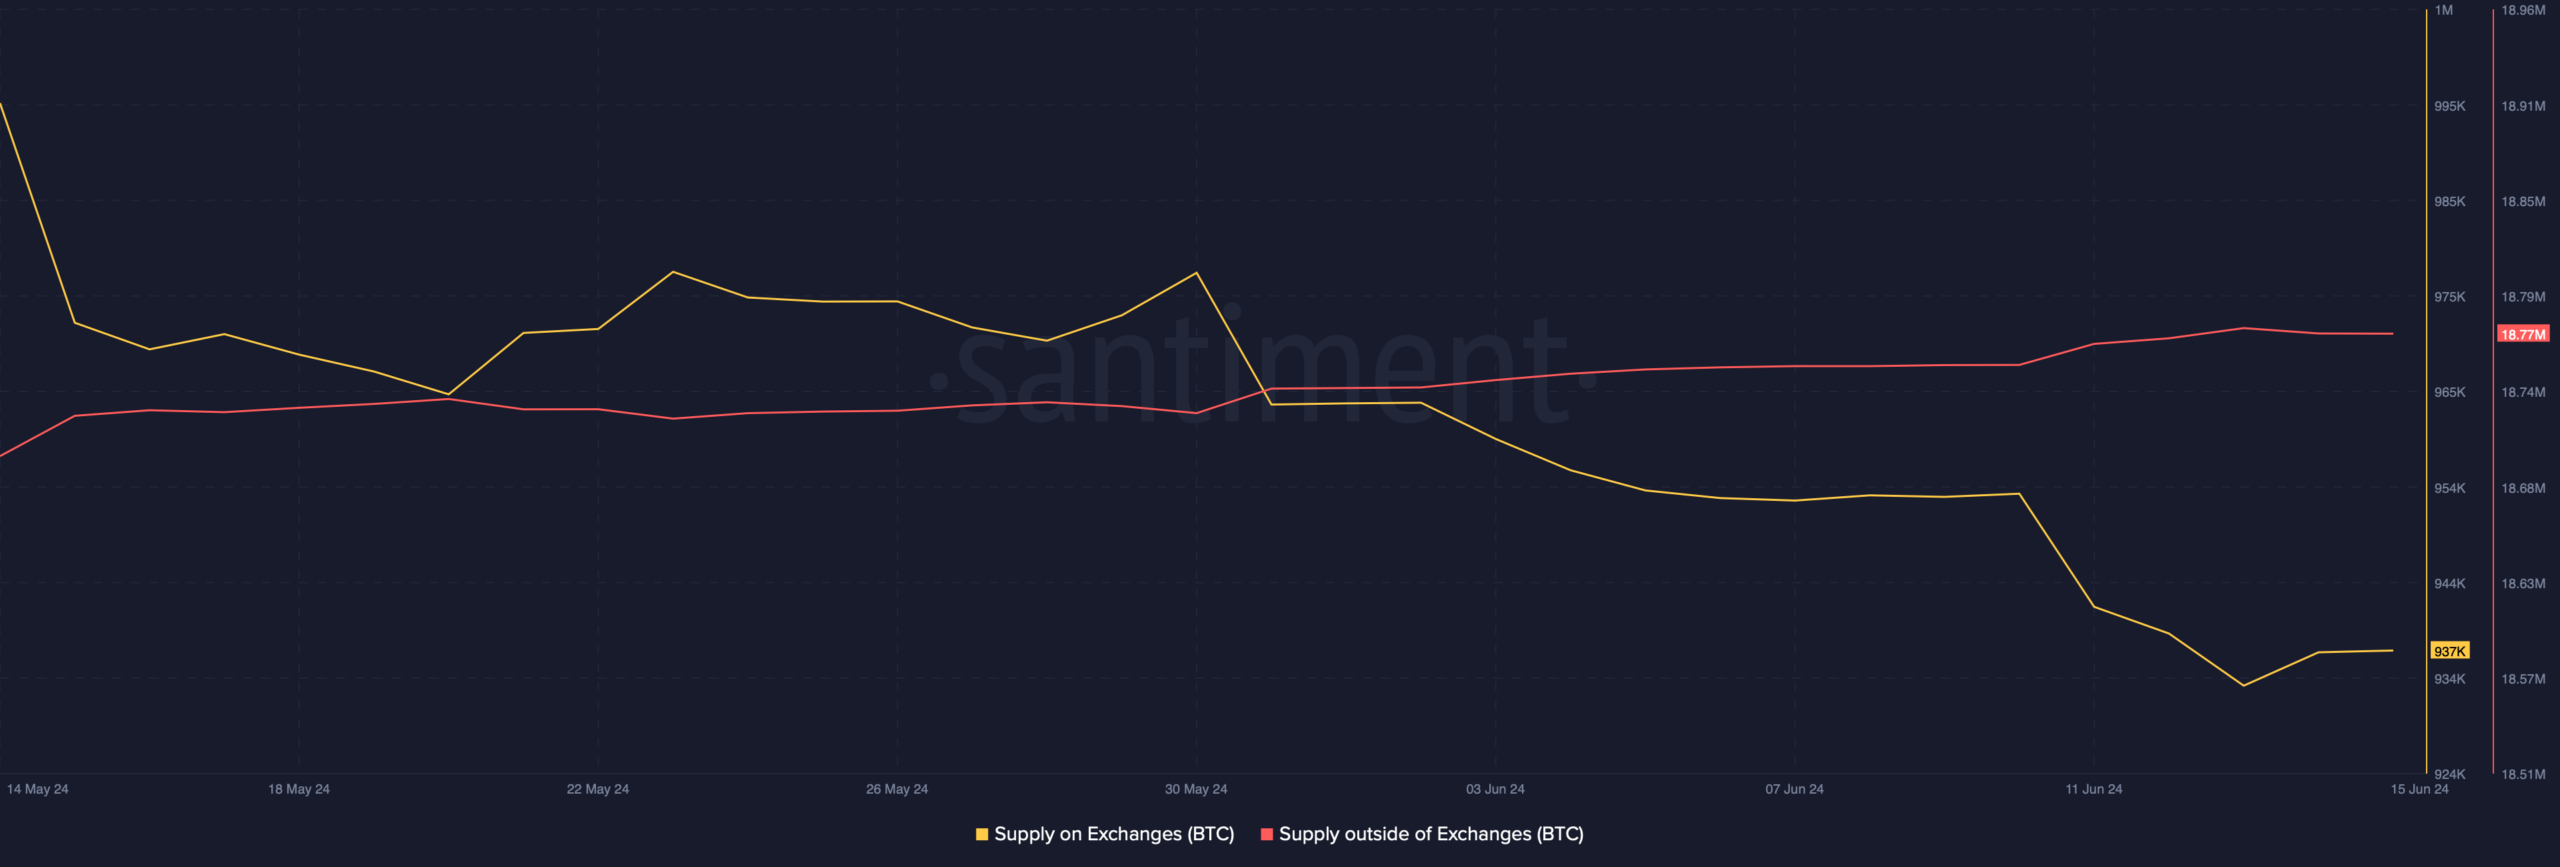
Source: Santiment
As per the same, buying pressure on BTC has continued to remain high, which can be inferred as a bullish signal. This was evidenced by the drop in its supply on exchanges and a rise in its supply outside of exchanges.
A look at Glassnode’s data also underlined that BTC’s NVT ratio declined. A drop in this metric usually points to a price uptick in the future.
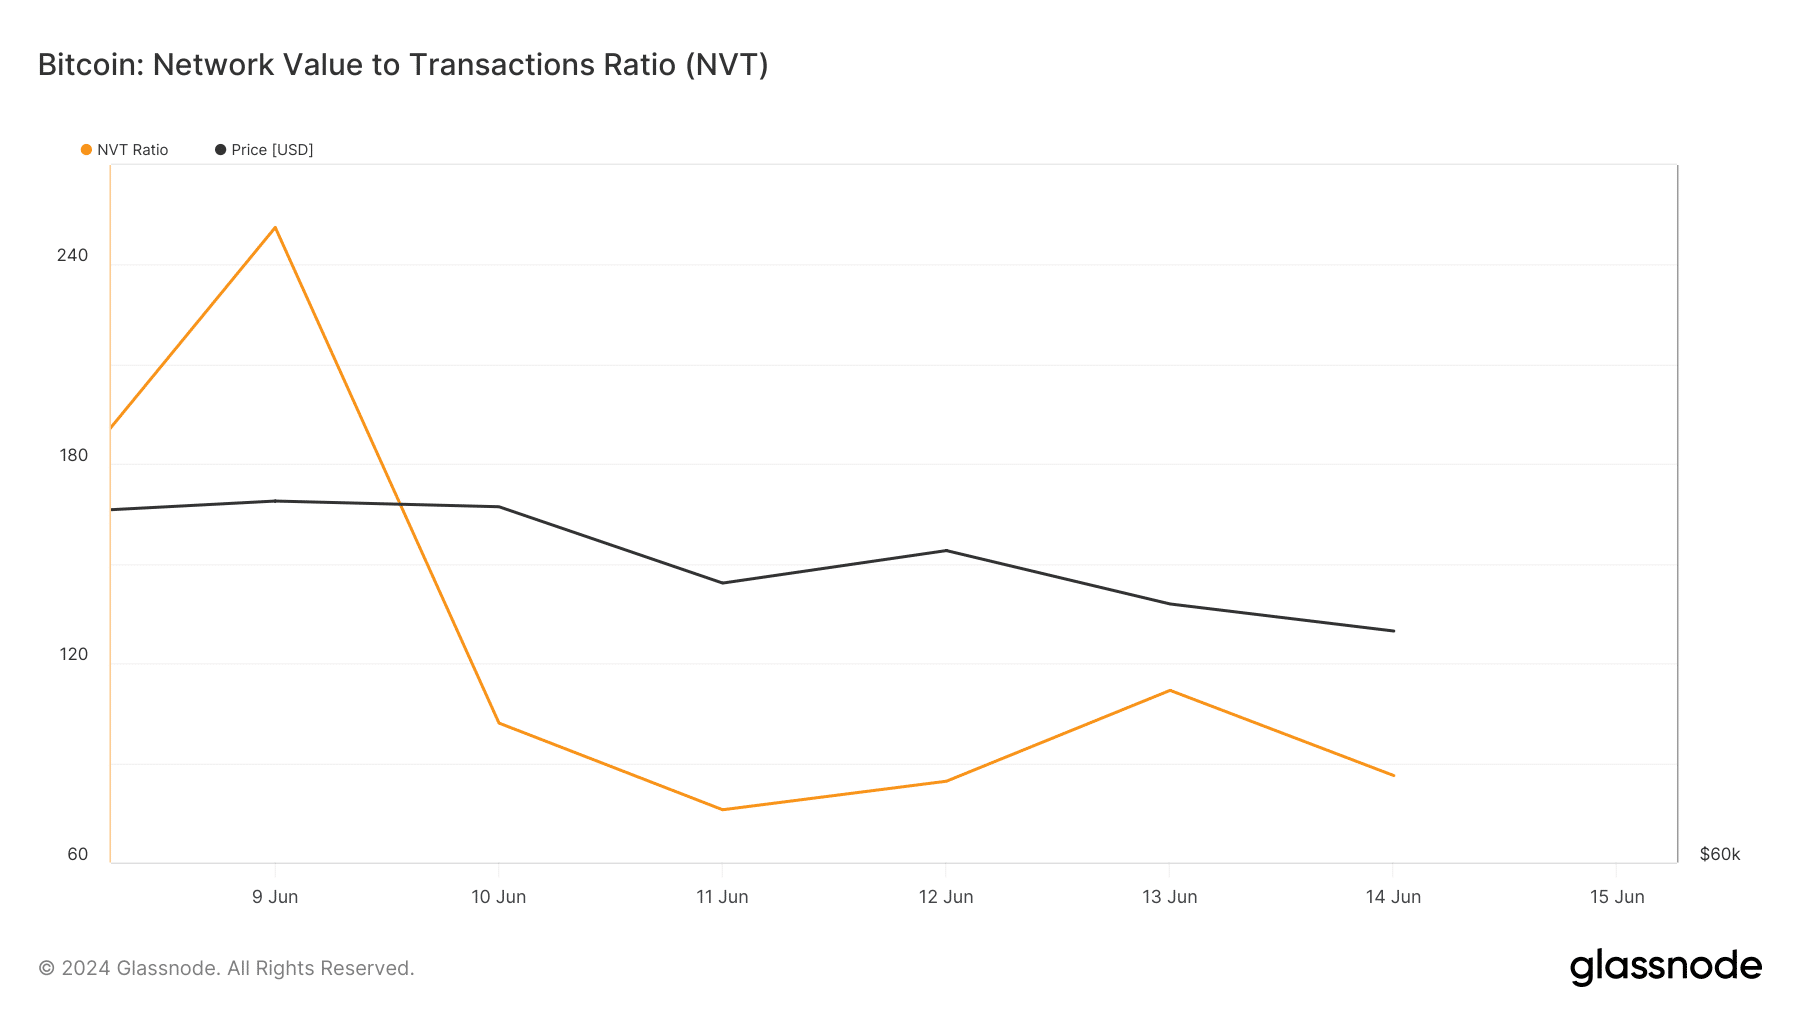
Source: Glassnode
Read Bitcoin’s [BTC] Price Prediction 2024-25
Finally, AMBCrypto’s analysis of the cryptocurrency’s daily chart revealed that BTC’s price touched the lower limit of the Bollinger Bands, indicating a possible price rebound.
On the contrary, the MACD flashed a bearish advantage, which hinted at a further price decline. Ergo, some degree of caution wouldn’t be the worst idea for traders looking to take advantage of Bitcoin’s prevailing market trend.
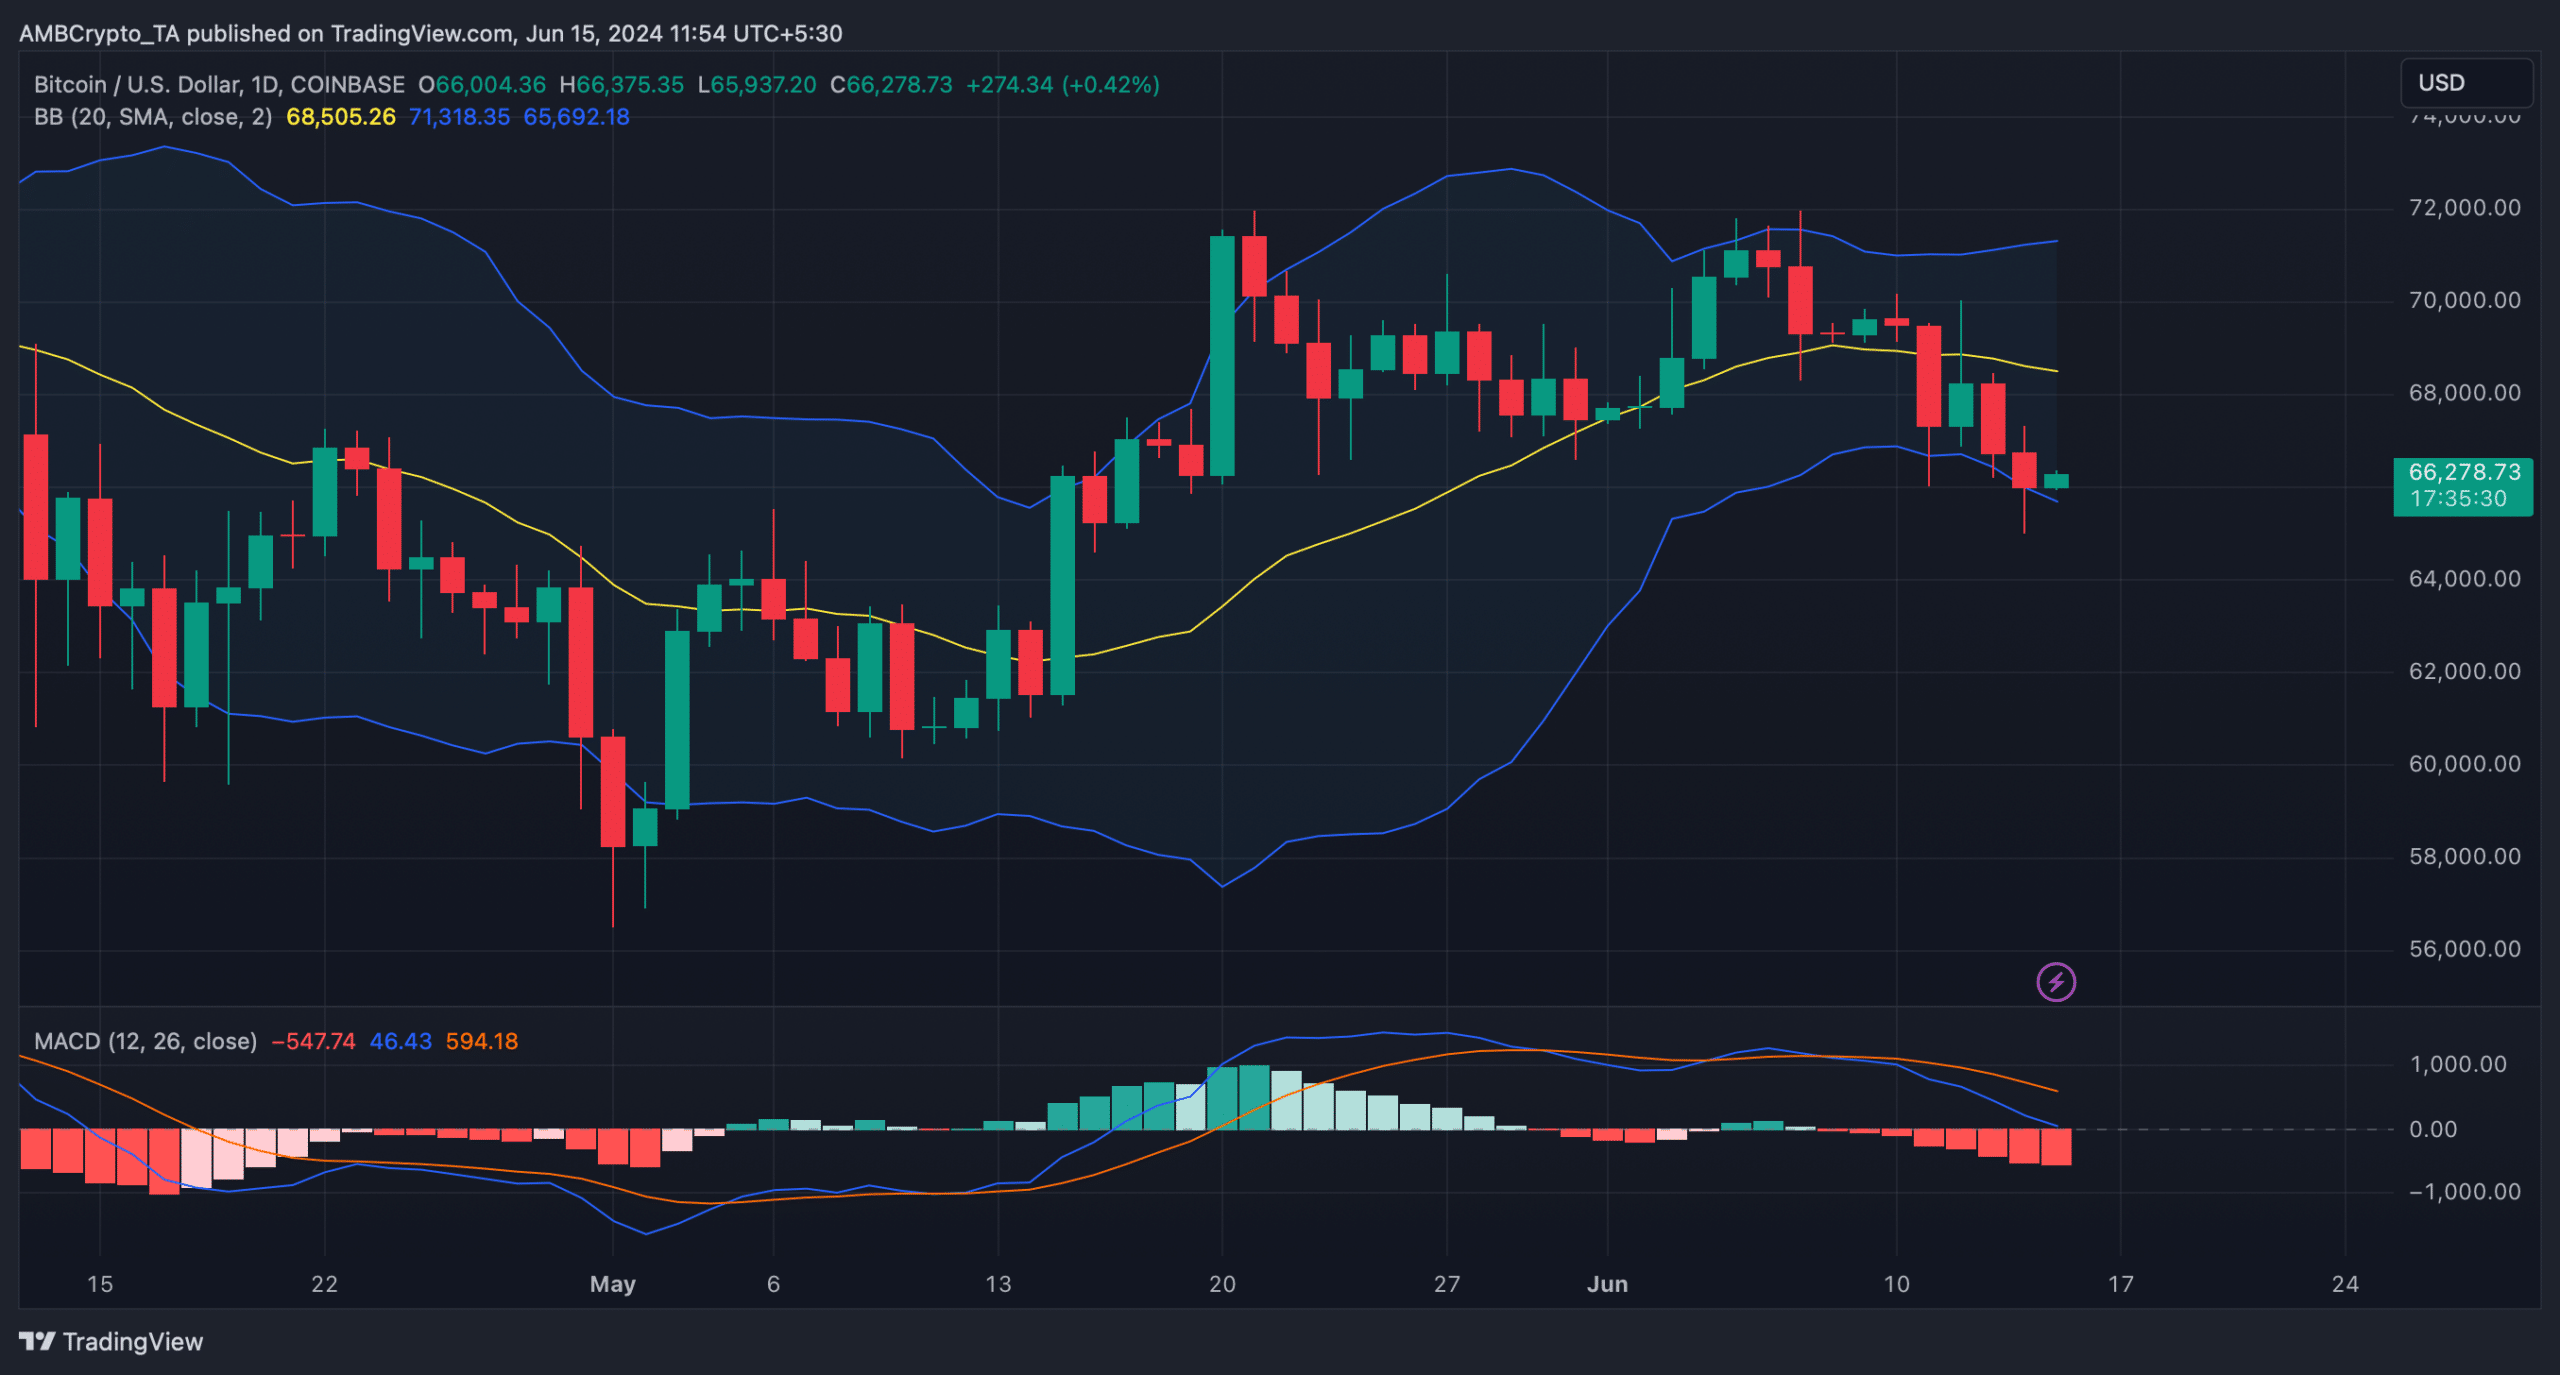
Source: TradingView