
- Polygon was down by more than 18% in the last 30 days.
- Though selling pressure was high, market indicators looked bullish.
Over the months, Polygon [MATIC] has lost a substantial amount of its market capitalization. MATIC now ranks 20th in terms of the top cryptos by market cap. However, the entire situation can change soon, as the token might have reached a market bottom.
Polygon turns bullish
CoinMarketCap’s data revealed that the token’s price had dropped by more than 18% in the last 30 days. However, the last few days were in investors’ favor as MATIC’s price increased by more than 2% in the last 24 hours.
At the time of writing, MATIC was trading at $0.5652 with a market capitalization of over $5.5 billion. The better news was that this uptick might just be the beginning of a bull rally.
ZAYK Charts, a popular crypto analyst, recently posted a tweet highlighting an interesting development. As per the tweet, MATIC was testing the support of a bullish falling wedge pattern.
Since its daily chart was green, the chances of a successful breakout above the pattern looked likely.
If that happens, then investors might soon witness Polygon jumping by 70%–80% in the coming days or weeks. In fact, a bullish divergence was also seen on its Relative Strength Index (RSI) chart, which further supported the possibility of a massive bull rally soon.

Source: X
Is a bull rally around the corner?
AMBCrypto then planned to have a look at Polygon’s on-chain data to find out whether a bull rally was possible. We found that the token’s MVRV ratio improved substantially last week, which can be interpreted as a bullish signal.
However, after a drop, MATIC’s supply on exchanges went up, meaning that selling pressure was high.
Whales confidence in MATIC also seemed to have dwindled as its supply held by top addresses dropped. This meant that the top players in the crypto space were expecting a price correction.
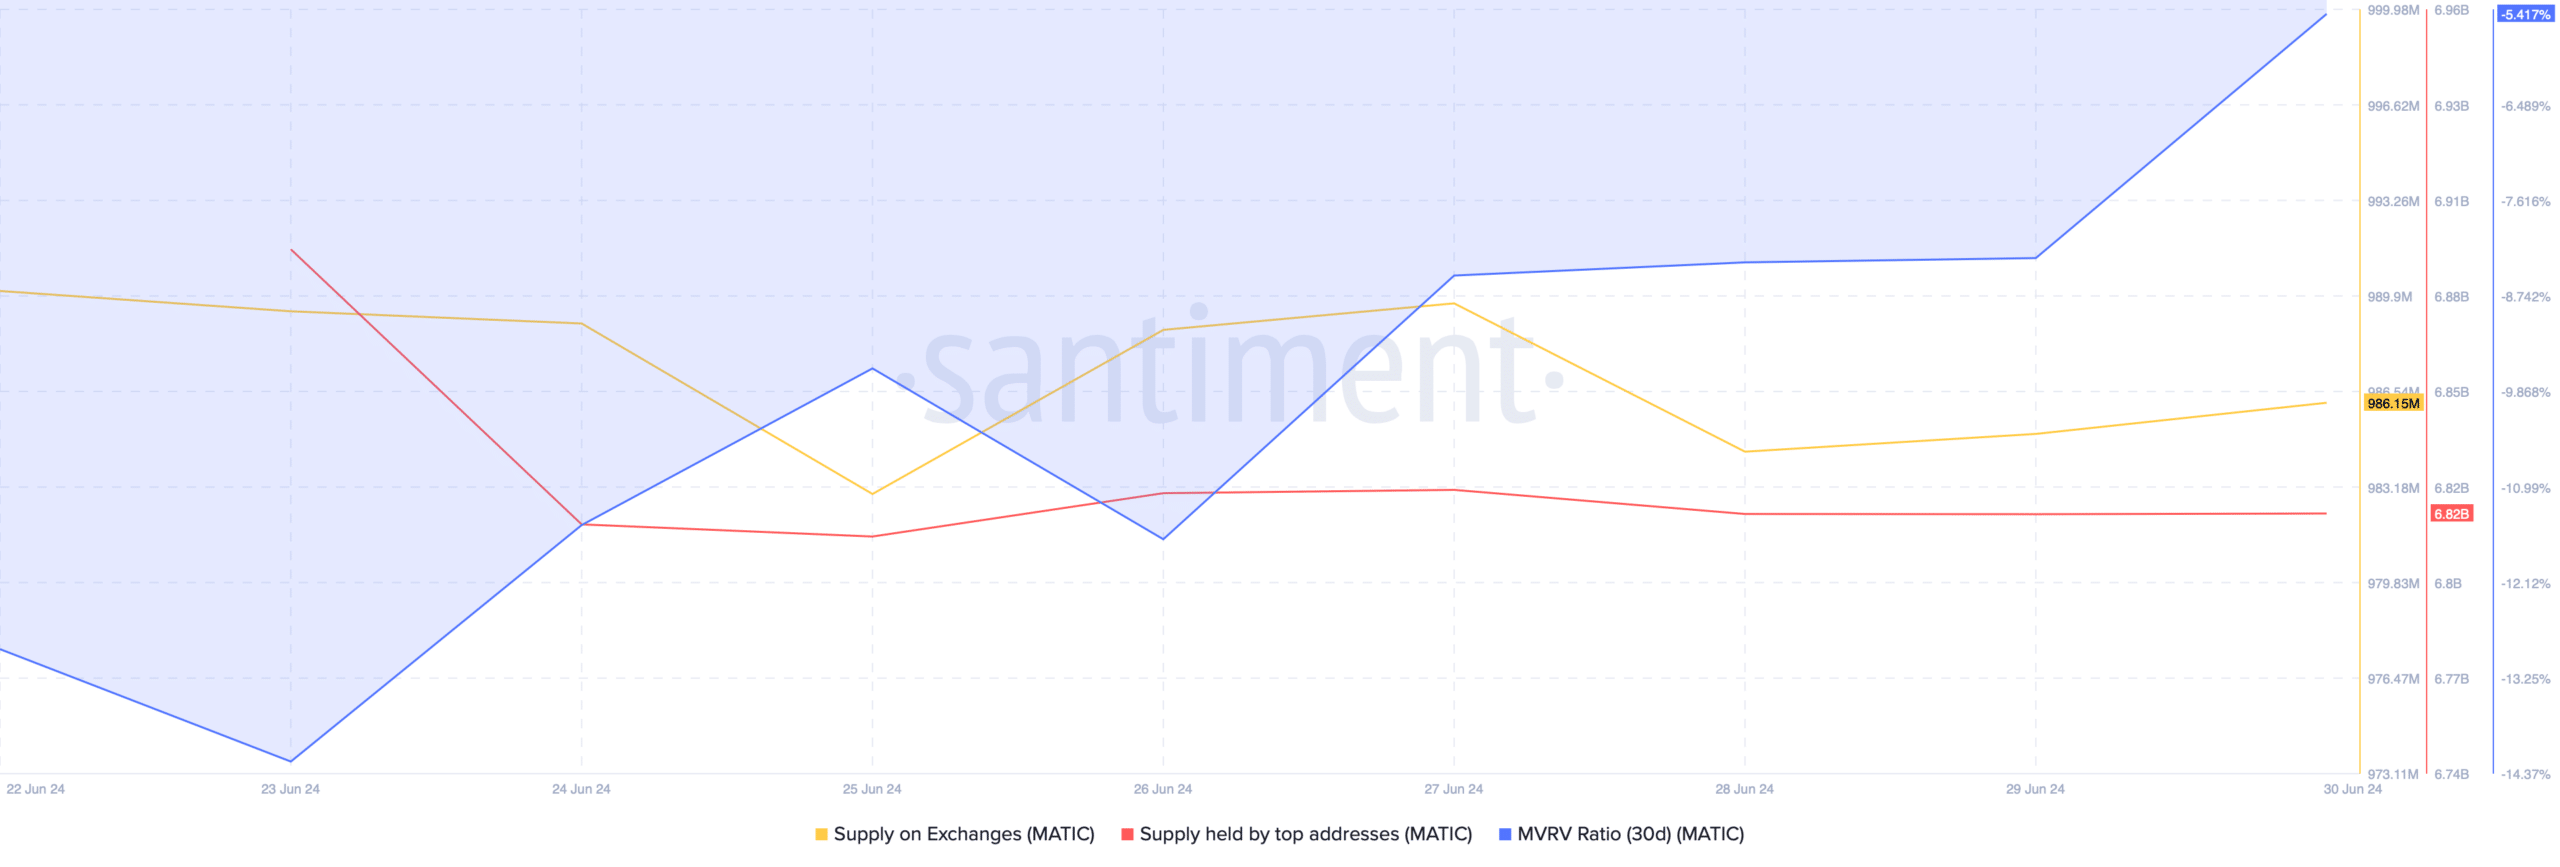
Source: Santiment
Our analysis of MATIC’s daily chart revealed that its Chaikin Money Flow (CMF) registered an uptick. Its Relative Strength Index (RSI) also followed a similar increasing trend.
On top of that, the MACD displayed a bullish crossover. All of these indicators suggested that the chances of a price increase were high.
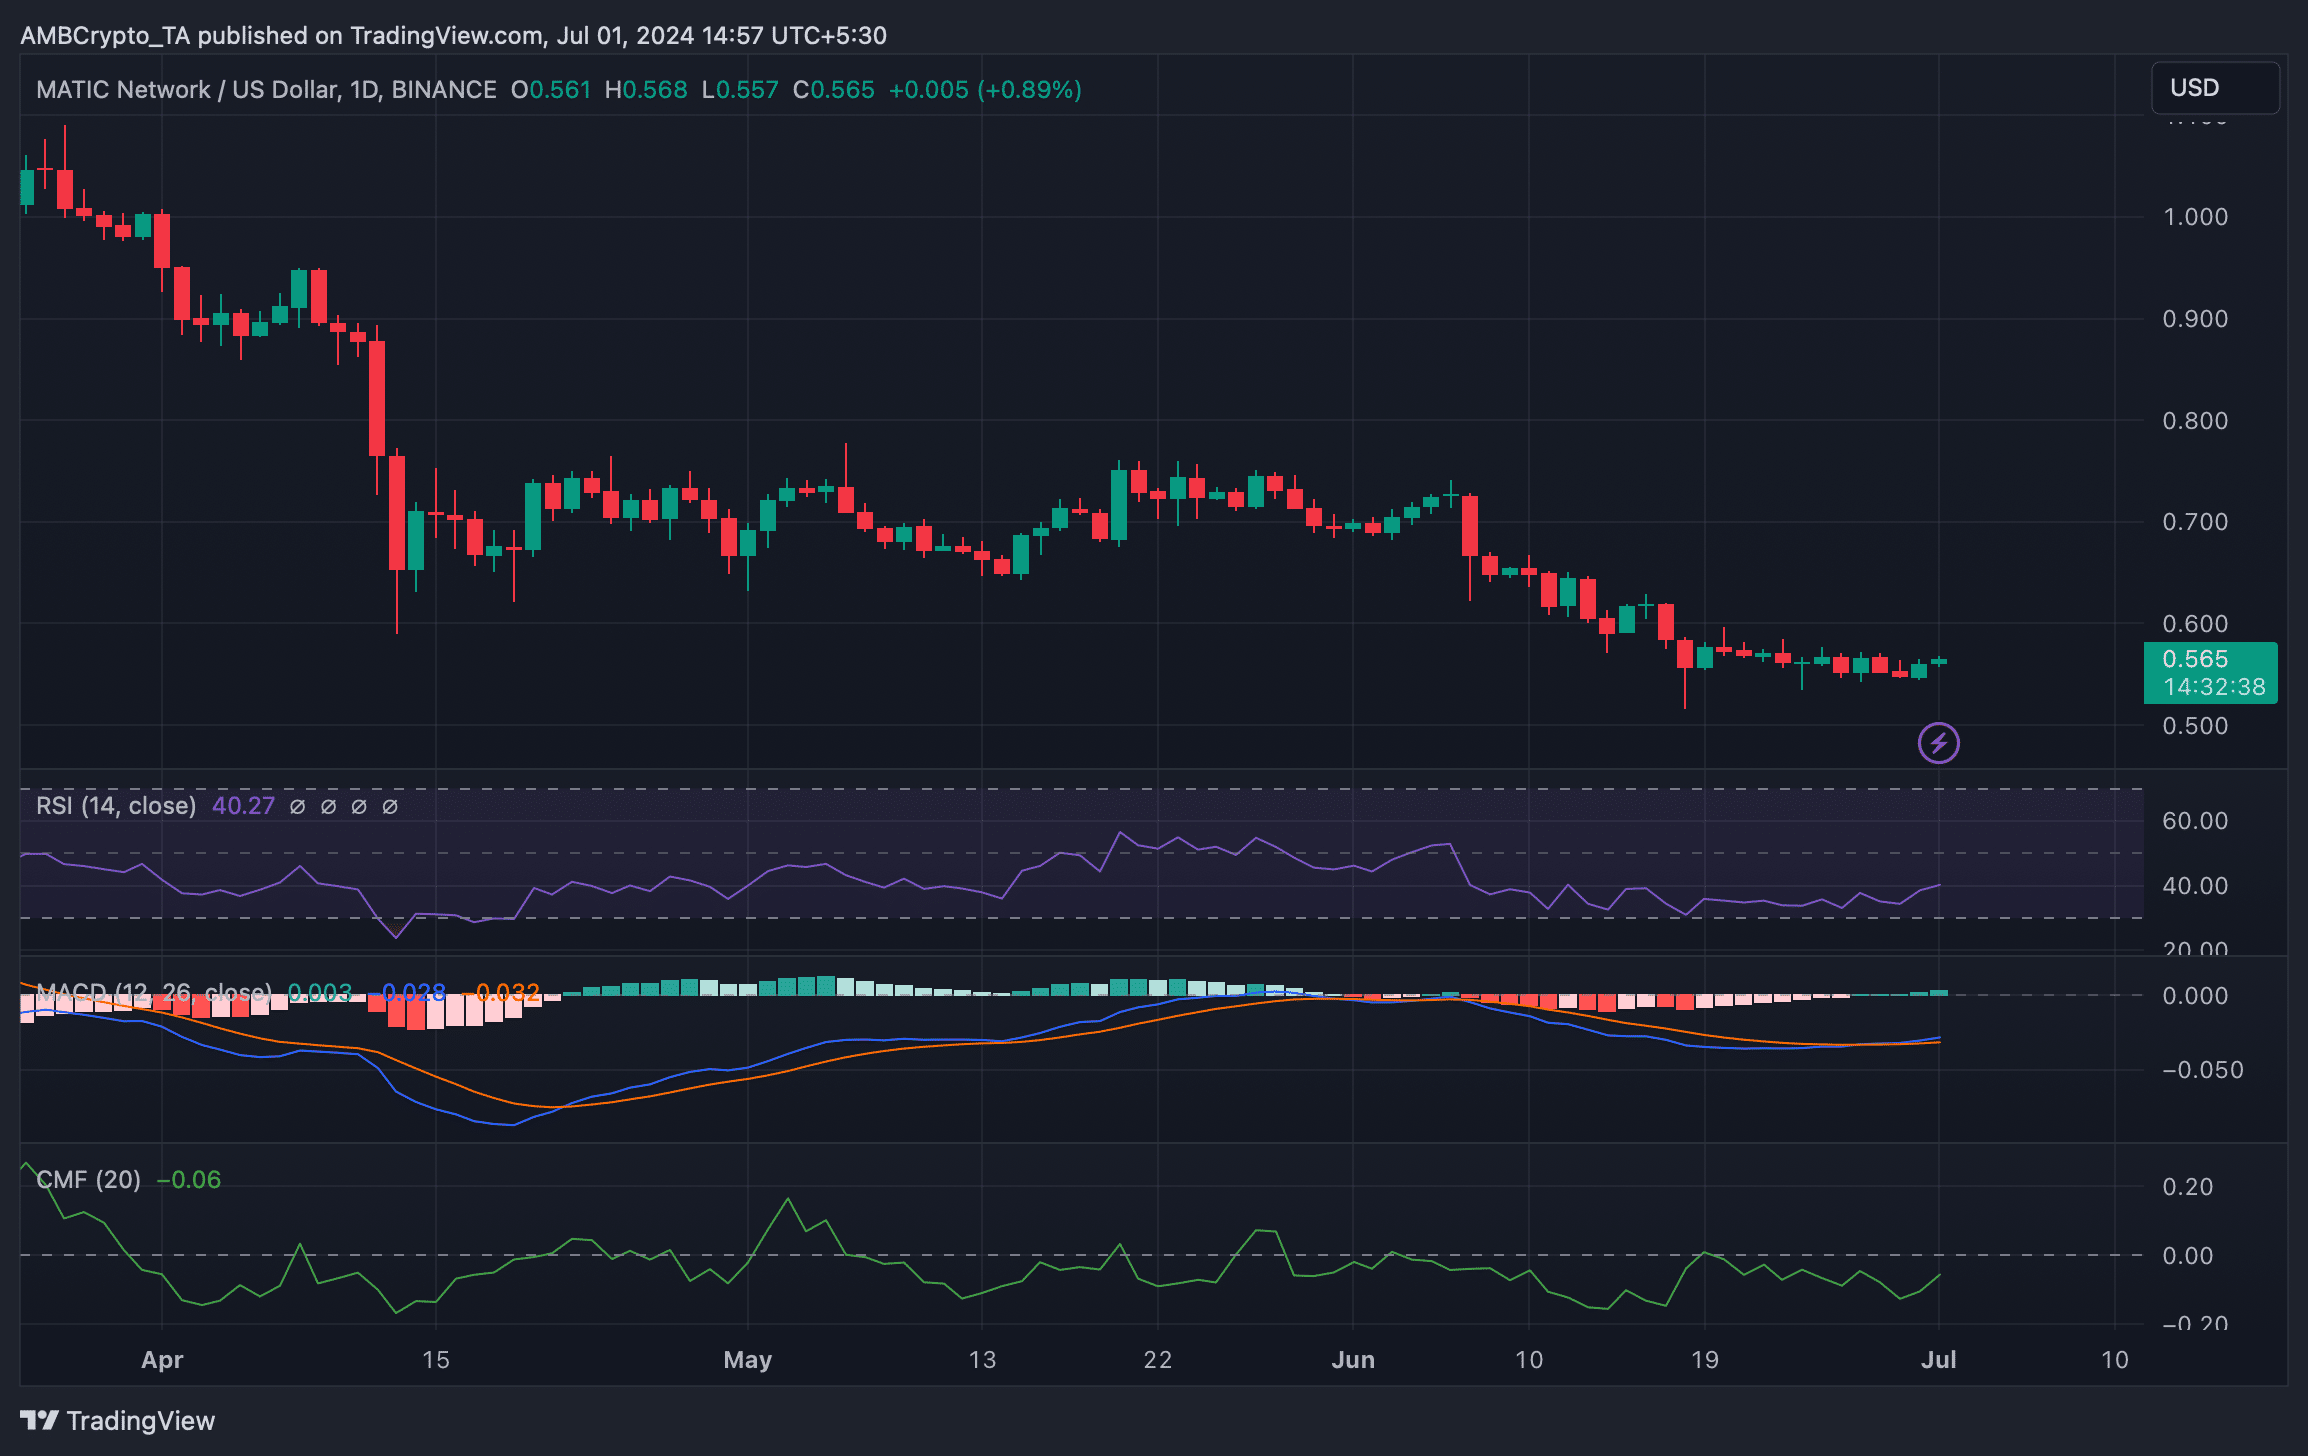
Source: TradingView
Is your portfolio green? Check out the MATIC Profit Calculator
If Polygon manages to remain bullish, then it is crucial for it to cross the $0.57 mark as liquidation would rise. Generally, a hike in liquidation results in a price correction.
A breakout above that would open ways for the token to touch $0.6. However, if the bears step in, then MATIC might fall to $0.54.

Source: Hyblock Capital