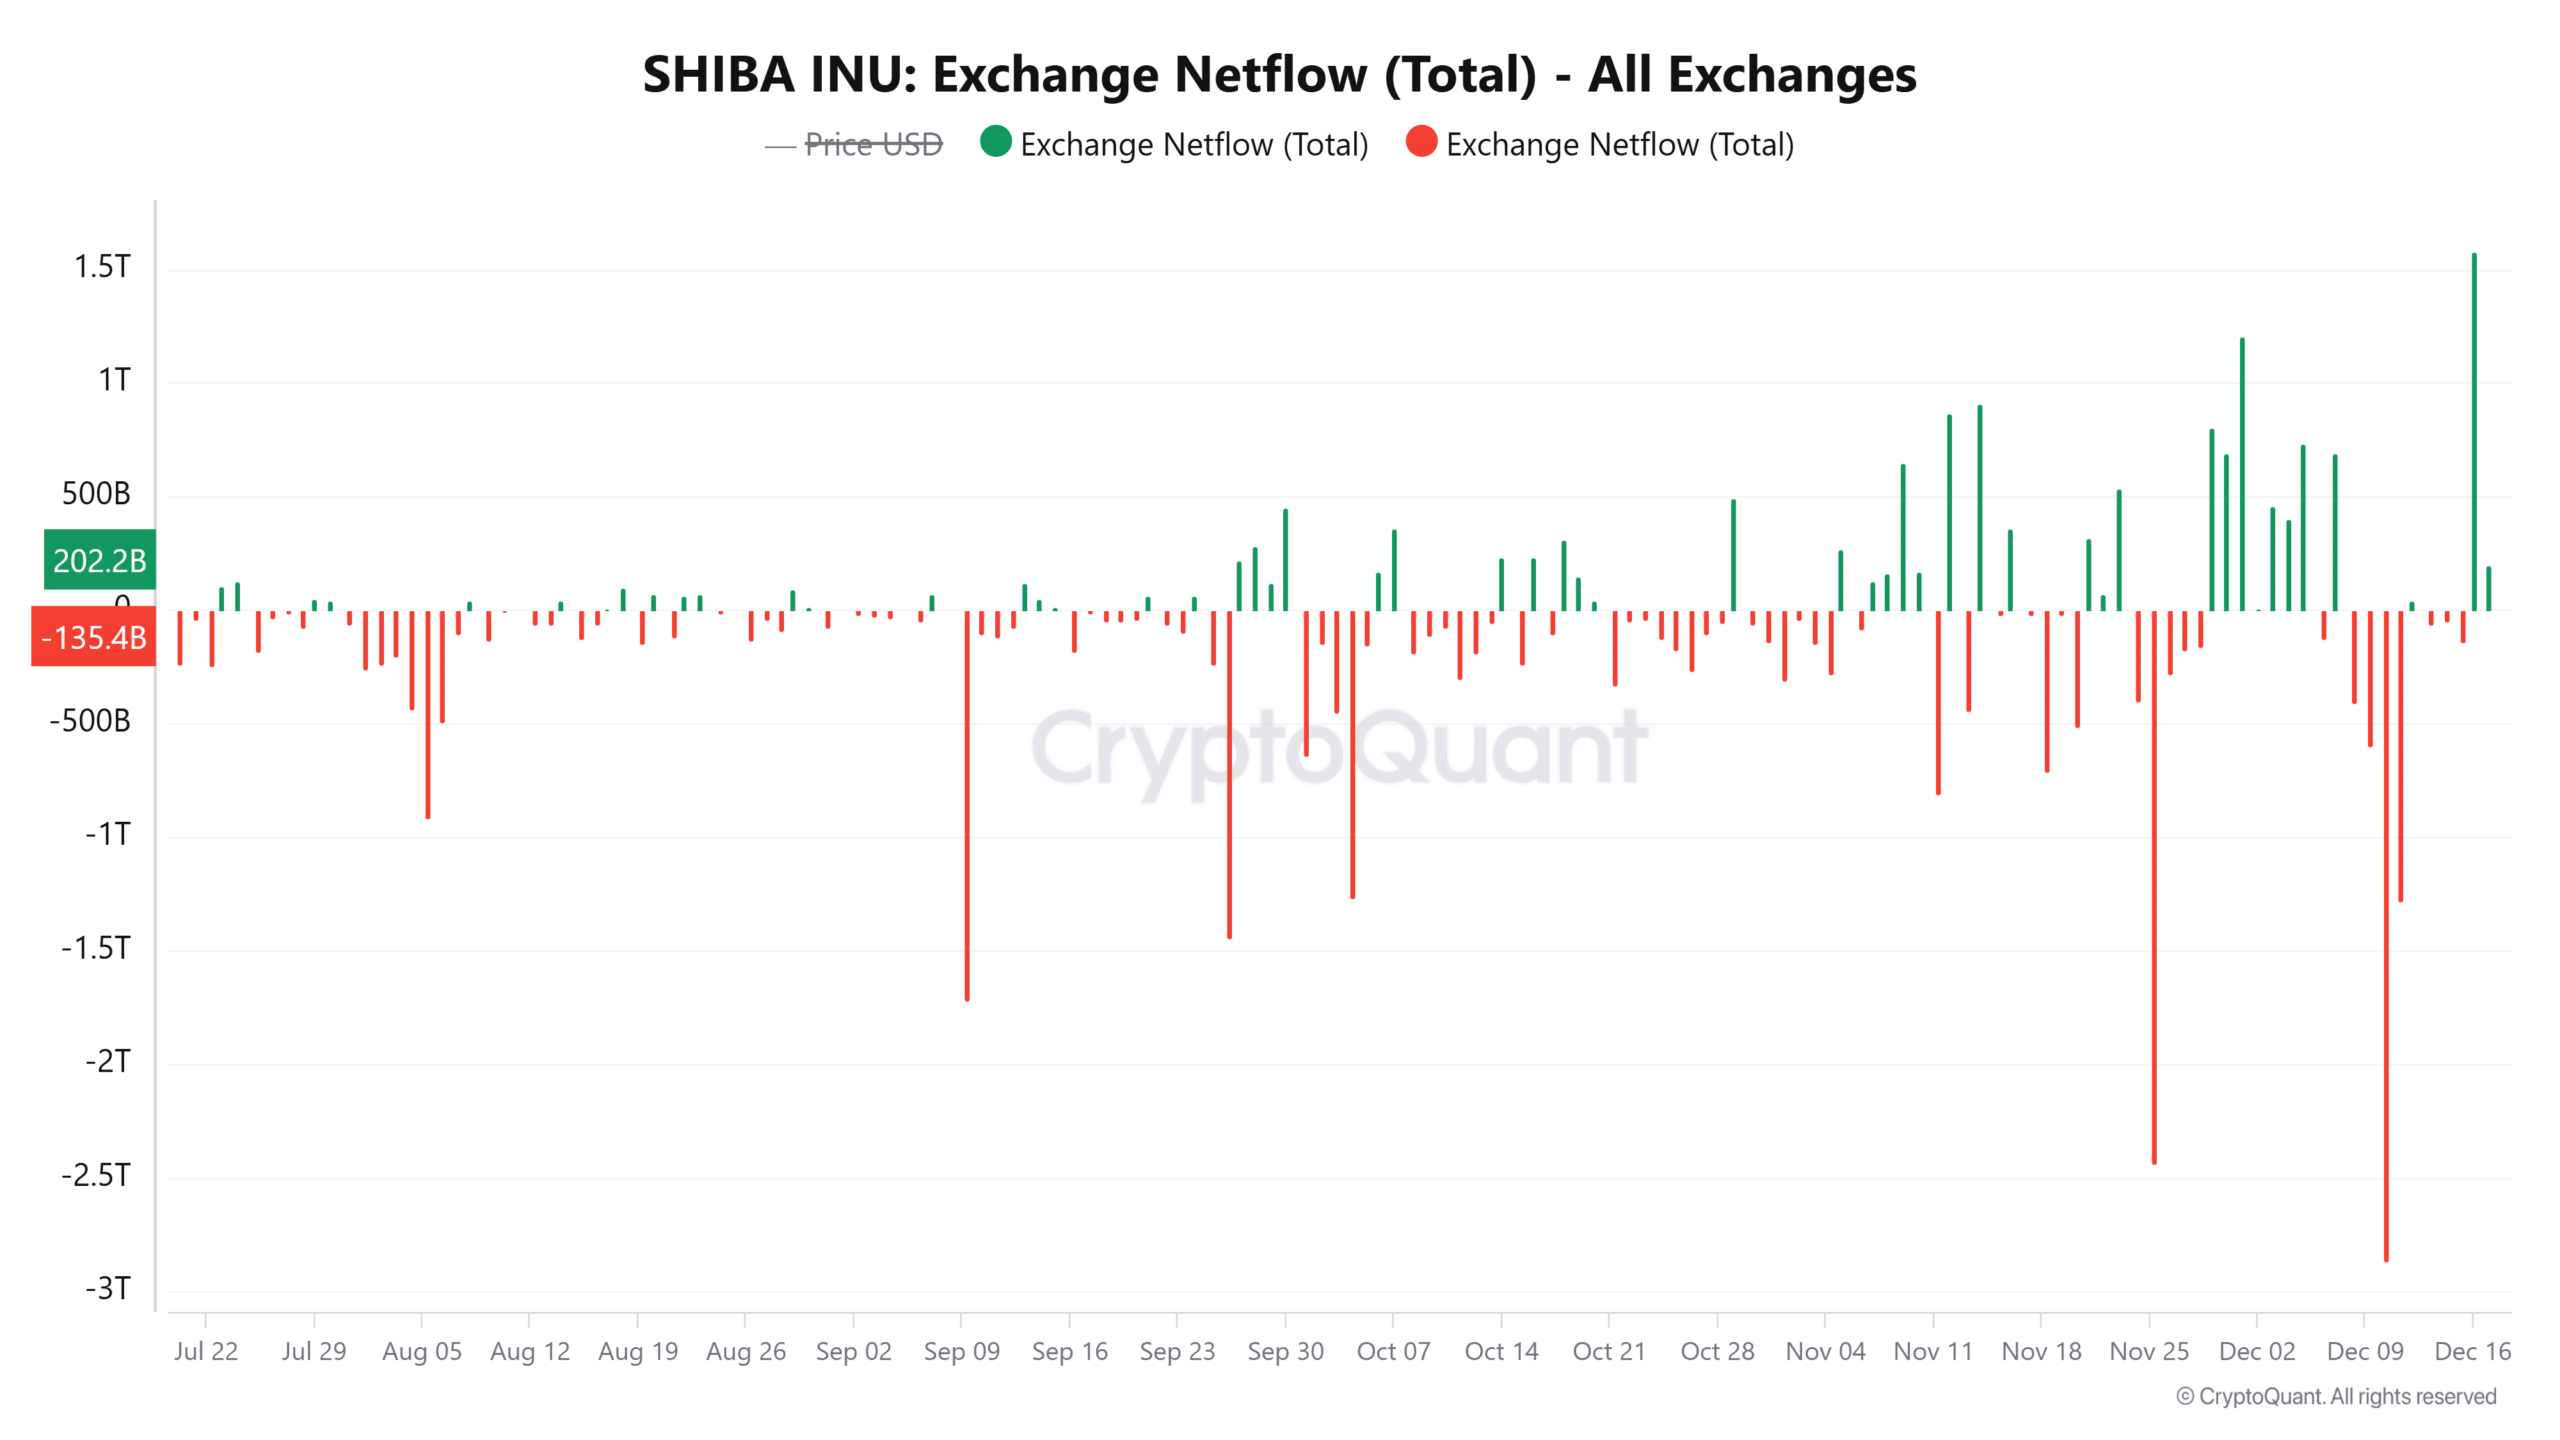
- More than 1.7 trillion SHIB tokens have been moved to exchanges in the last two days.
- If SHIB fails to hold support at $0.000024, it could lead to a steep decline.
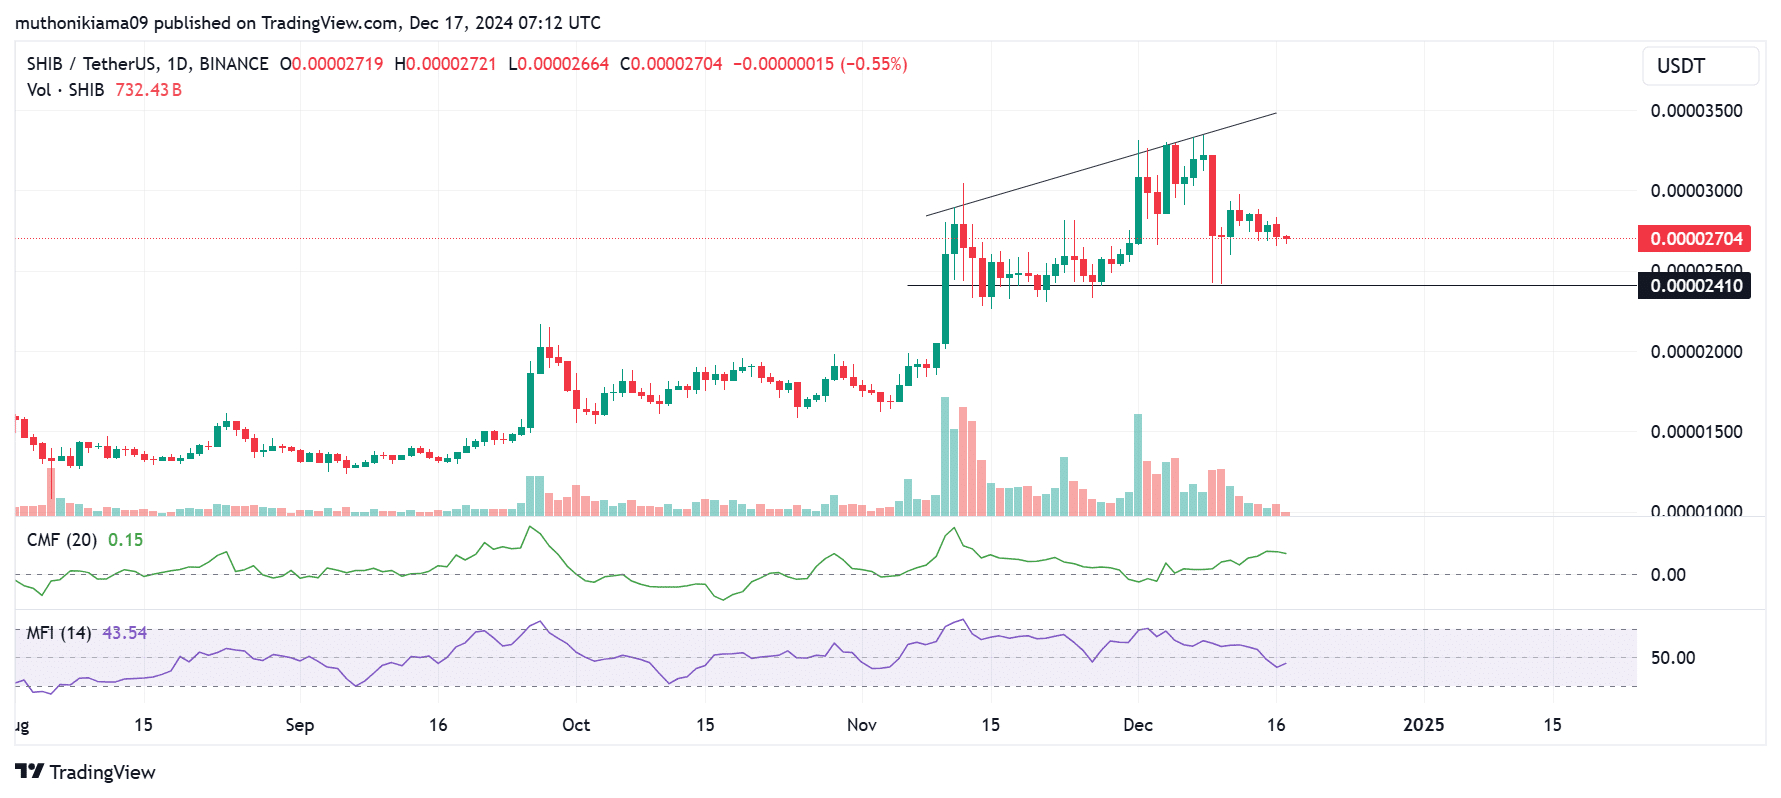
Shiba Inu [SHIB] traded at $0.0000268 at press time, after a 1.9% drop in 24 hours.
The second-largest memecoin by market capitalization was still up by 10% over the past month, but weak buying activity has curtailed the uptrend.
SHIB had formed a right-angled ascending broadening wedge pattern on its one-day chart. This chart pattern usually indicates a bullish continuation if the price breaks above the upper trendline.
However, the volume histogram bars have shortened, indicating reduced trading activity and a lack of adequate buying volumes to support an uptrend.


Source: Trading View
The Money Flow Index (MFI) stood at 43, indicating weak momentum. This indicator has also sloped downwards, which shows that more sellers are entering the market.
On the other hand, the Chaikin Money Flow (CMF) with a positive value of 0.15, showed that buying pressure was still more than selling pressure.
As buyers and sellers fight for control, it could lead to SHIB consolidating within this channel.
Shiba Inu exchange inflows surge
Data from CryptoQuant depicted a significant rise in SHIB crypto inflows to exchanges. On the 16th of December, SHIB’s net inflows to exchanges reached the highest level in nearly five months.
Moreover, in the last two days, over 1.78 trillion SHIB has been moved to exchanges.


Source: CryptoQuant
If traders are continually moving their tokens to exchanges, and there is inadequate demand to absorb the sell-side pressure, it could cause more dips for the meme coin.
Key levels to watch
The In/Out of the Money Around Price (IOMAP) metric shows that 43,080 addresses purchased SHIB at between $0.000024 and $0.000025.
This makes this zone a strong support level, as traders might view it as a good entry point due to the profitability of these addresses.


Source: IntoTheBlock
Conversely, there is a supply zone at $0.000030-$0.000031 where more than 3 trillion SHIB tokens were bought by 37,230 addresses.
As SHIB approaches this zone, it is bound to face resistance if the traders who are currently holding at a loss decide to sell to minimize their losses.
Read Shiba Inu’s [SHIB] Price Prediction 2024–2025
Long/Short Ratio shows a bearish bias
Shiba Inu’s Long/Short Ratio showed that bearish bets have been more than bullish bets for the past week. At press time, this ratio stood at 0.96, and it has been oscillating below 1 since the 7th of December.


Source: Coinglass
The high number of short sellers shows that most traders are expecting SHIB to continue with its bearish trends.

