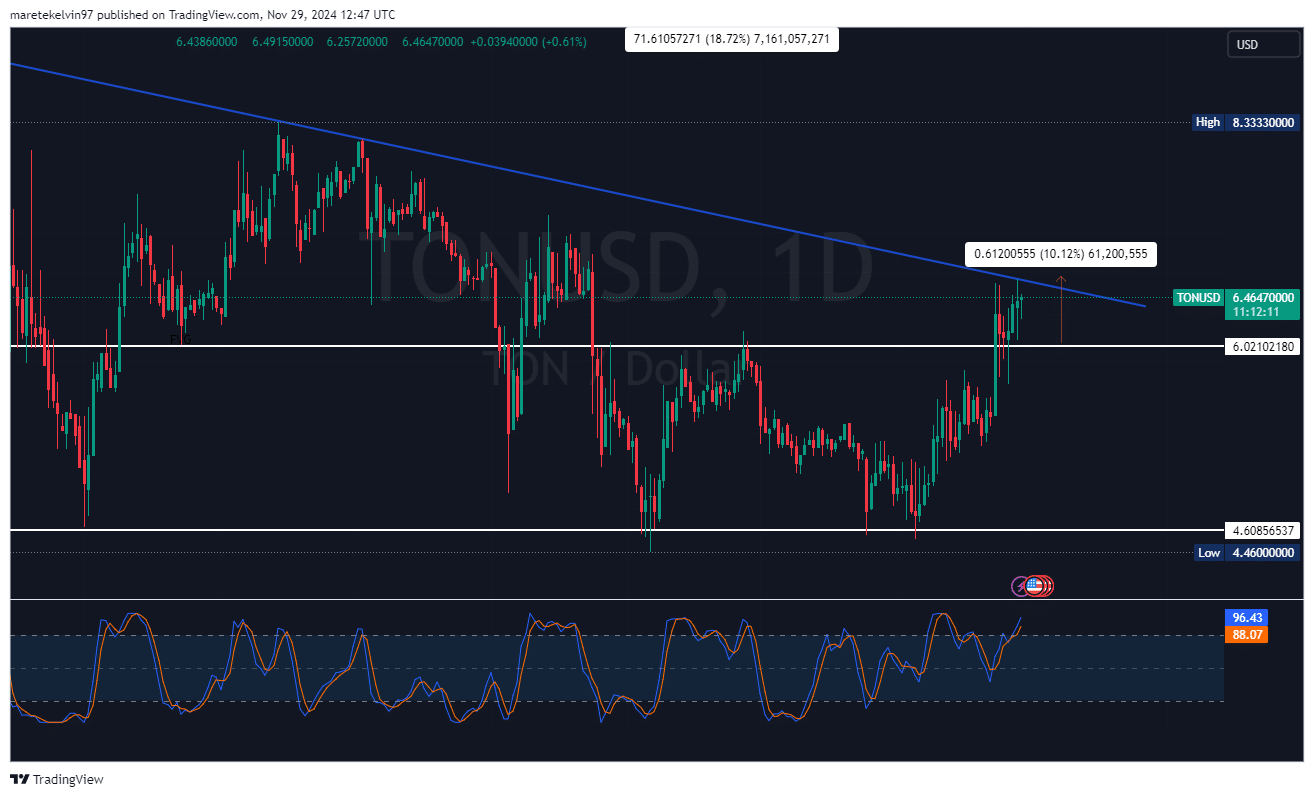
- At the time of writing, Toncoin’s price seemed to be approaching a key trendline resistance level
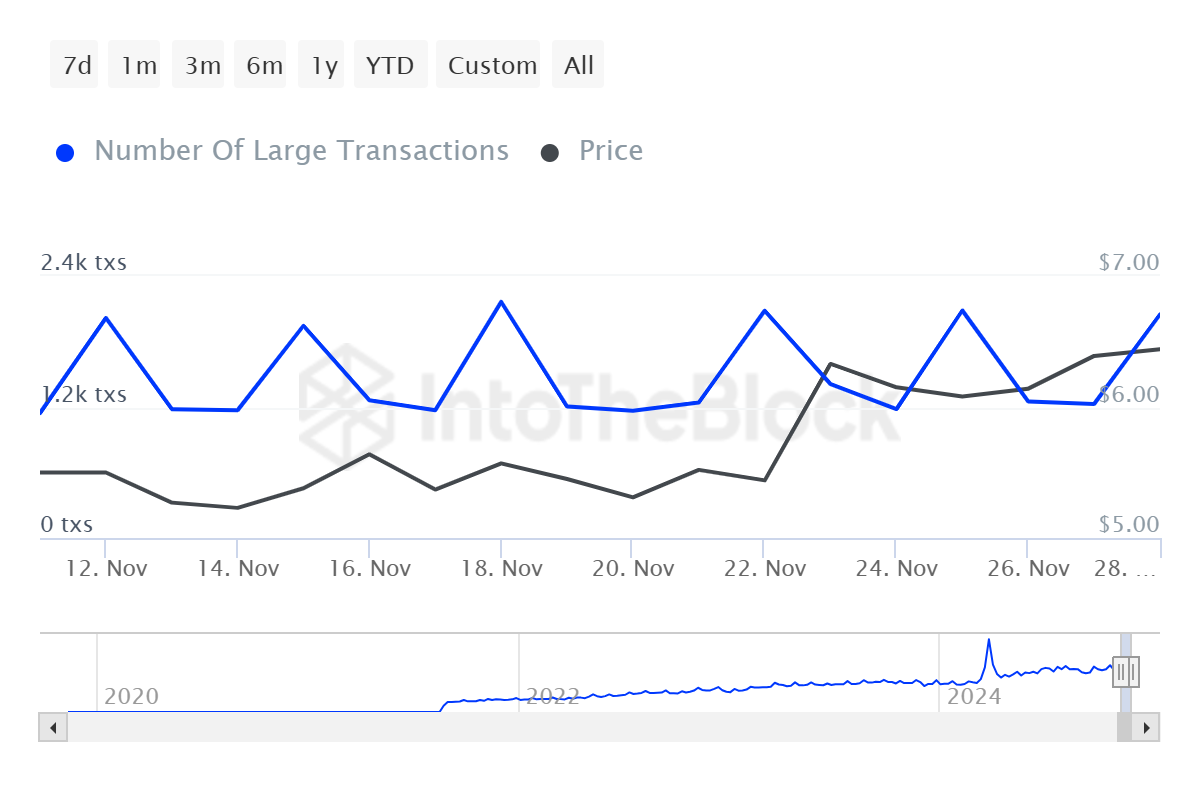
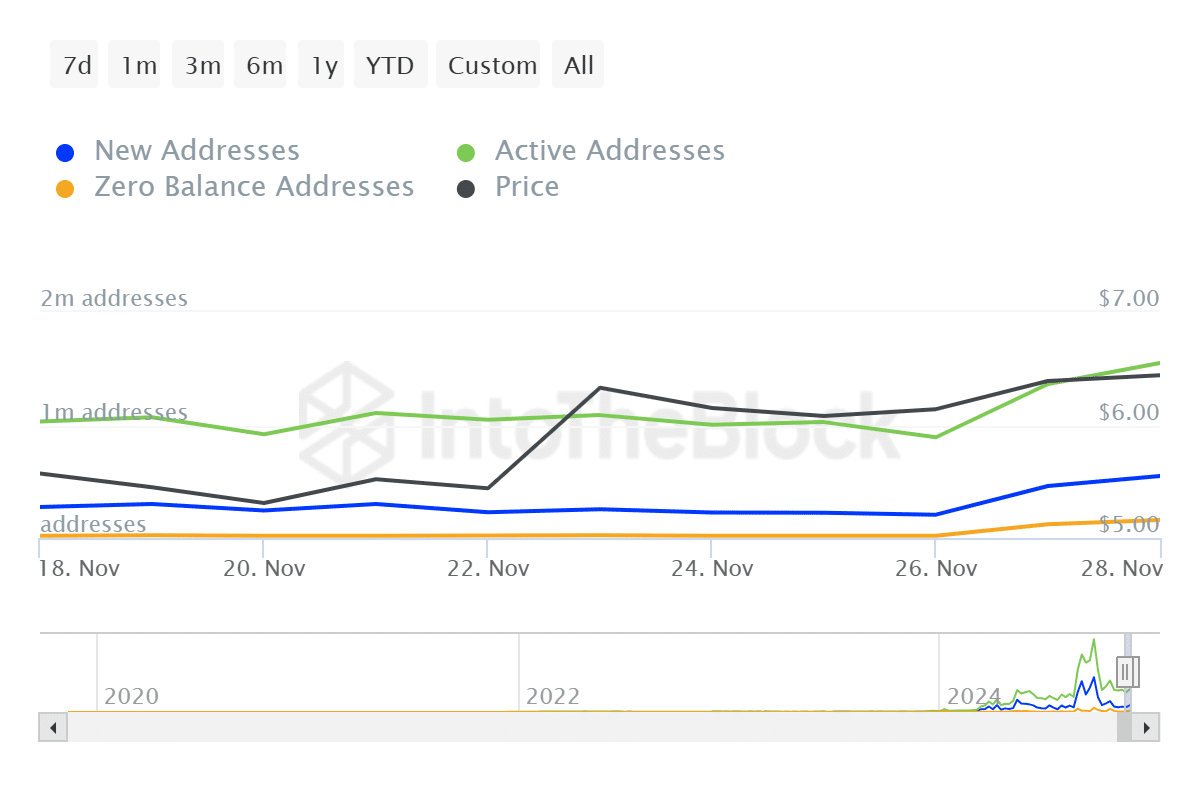
- Active Addresses and large transactions surged over the last 24 hours
Toncoin (TON) has been attracting much attention lately, with its on-chain metrics giving bullish signals for a potential breakout. At press time, the altcoin was testing a key descending trendline too, following a strong 10% rally from the $6.02-level.
With 72% of its total addresses in profit, the market seemed to be fairly optimistic. Hence, the question – Will this building momentum break its resistance?
Toncoin whale activity hits new highs
TON whales are making big moves. According to IntoTheBlock’s data, large transactions increased by 110% in the last 24 hours alone. This order flow of high-value trades usually indicates strong market confidence.
The hike in whale activity might generate the buying pressure necessary to push TON’s price past its current resistance level on the charts.
In fact, the uptick in whale activity is in line with broader market volatility too—An indicator that major players are positioning themselves for Toncoin’s next big move.

Source: IntoTheBlock
Active addresses surge
Alongside the increase in whale activity, a 14% hike in Toncoin active addresses further highlighted the growing interest in the altcoin.


Source: IntoTheBlock
At the same time, 72% of Toncoin addresses were in profit at its press time price levels. This positive profitability metric indicated a strong market sentiment, one which often supports bullish trends.
However, it also suggested that any pullback on the charts could trigger selling pressure. Especially as investors look to secure gains.


Source: IntoTheBlock
A key trendline resistance
On the technical front, Toncoin’s price seemed to be approaching a key trendline resistance on the daily charts. This resistance level spearheaded several successful reversals recently, making the price level a critical decision point.
A successful breakout above this trendline resistance could see the altcoin post a strong bullish move, potentially targeting the $7 zone.
Conversely, failure to break through the trendline key resistance level may lead to a retracement, with the $6.02-level acting as the first support level.


Source: TradingView

